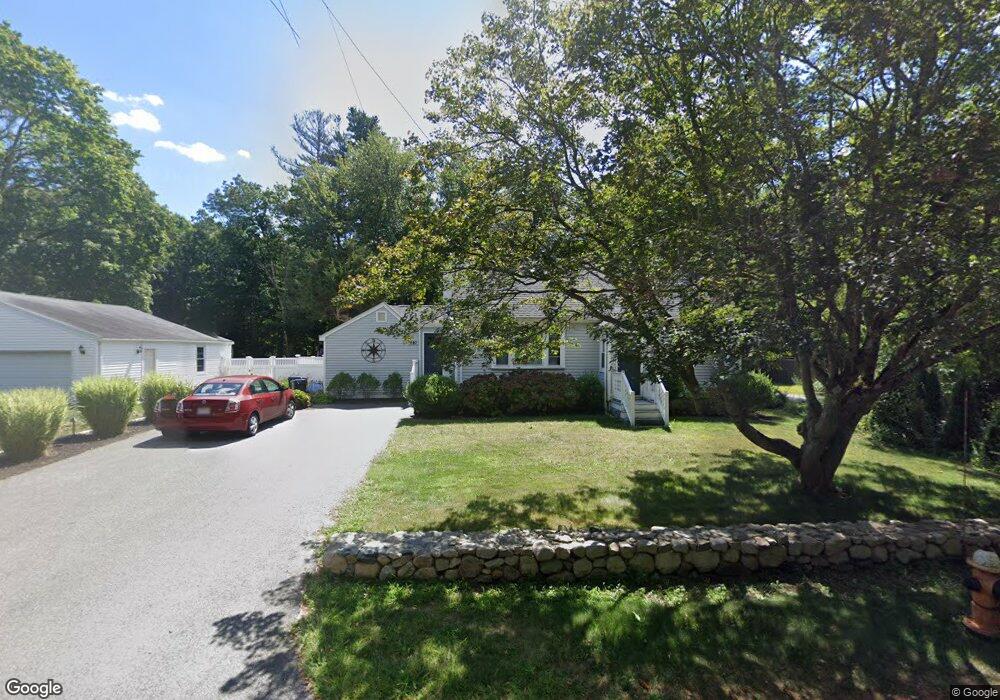
842 Webster St Hanover, MA 02339
Estimated Value: $1,149,000 - $1,399,000
About This Home
This home is located at 842 Webster St, Hanover, MA 02339 and is currently estimated at $1,281,892, approximately $418 per square foot. 842 Webster St is a home located in Plymouth County with nearby schools including Hanover High School, South Shore Charter Public School, and Holy Family Elementary School.
Ownership History
We collect this data history from publicly available records. To have your information removed, we recommend requesting removal directly through your county’s website.
Purchase Details
Purchase Details
Home Values in the Area
Average Home Value in this Area
Purchase History
We collect this data history from publicly available records. To have your information removed, we recommend requesting removal directly through your county’s website.
| Date | Buyer | Sale Price | Title Company |
|---|---|---|---|
| $575,000 | -- | ||
| $152,000 | -- |
Mortgage History
We collect this data history from publicly available records. To have your information removed, we recommend requesting removal directly through your county’s website.
| Date | Status | Borrower | Loan Amount |
|---|---|---|---|
| Open | $460,000 |
Tax History
We collect this data history from publicly available records. To have your information removed, we recommend requesting removal directly through your county’s website.
| Year | Tax Paid | Tax Assessment Tax Assessment Total Assessment is a certain percentage of the fair market value that is determined by local assessors to be the total taxable value of land and additions on the property. | Land | Improvement |
|---|---|---|---|---|
| 2025 | $13,050 | $1,056,700 | $287,200 | $769,500 |
| 2024 | $12,622 | $983,000 | $287,200 | $695,800 |
| 2023 | $12,194 | $903,900 | $261,900 | $642,000 |
| 2022 | $12,471 | $817,800 | $249,200 | $568,600 |
| 2021 | $12,109 | $741,500 | $204,100 | $537,400 |
| 2020 | $11,901 | $729,700 | $215,700 | $514,000 |
| 2019 | $4,602 | $697,000 | $215,700 | $481,300 |
| 2018 | $10,593 | $650,700 | $215,700 | $435,000 |
| 2017 | $10,588 | $640,900 | $211,600 | $429,300 |
| 2016 | $10,332 | $612,800 | $193,000 | $419,800 |
| 2015 | $9,663 | $598,300 | $179,300 | $419,000 |
Map
- 25 Buffum Rd
- 70 Holly Berry Ln
- 42 Bard Rock Ln
- 14 Sugar Maple Cir Unit 14
- 36 Stone Meadow Ln
- 755 Main St
- 85 Maple Ave
- 491 Webster St
- 177 High St
- 16 Holly Ct
- 142 Marks St
- 198 Pond St
- 375 Webster St
- 40 Longwater Dr
- 13 Midfield Dr Unit 13
- 15 Midfield Dr Unit 15
- 36 Monroe Rd
- 20 Jackson Rd
- 114 Longwater Dr
- 313 E Water St
- 840 Webster St
- 832 Webster St
- 66 Shingle Mill Ln
- 850 Webster St
- 54 Shingle Mill Ln
- 824 Webster St
- 80 Shingle Mill Ln
- 42 Shingle Mill Ln
- 821 Webster St
- 884 Webster St
- 59 Shingle Mill Ln
- 92 Shingle Mill Ln
- 868 Webster St
- 808 Webster St
- 863 Webster St
- 876 Webster St
- 45 Shingle Mill Ln
- 87 Shingle Mill Ln
- 32 Shingle Mill Ln
- 106 Shingle Mill Ln
Ask me questions while you tour the home.