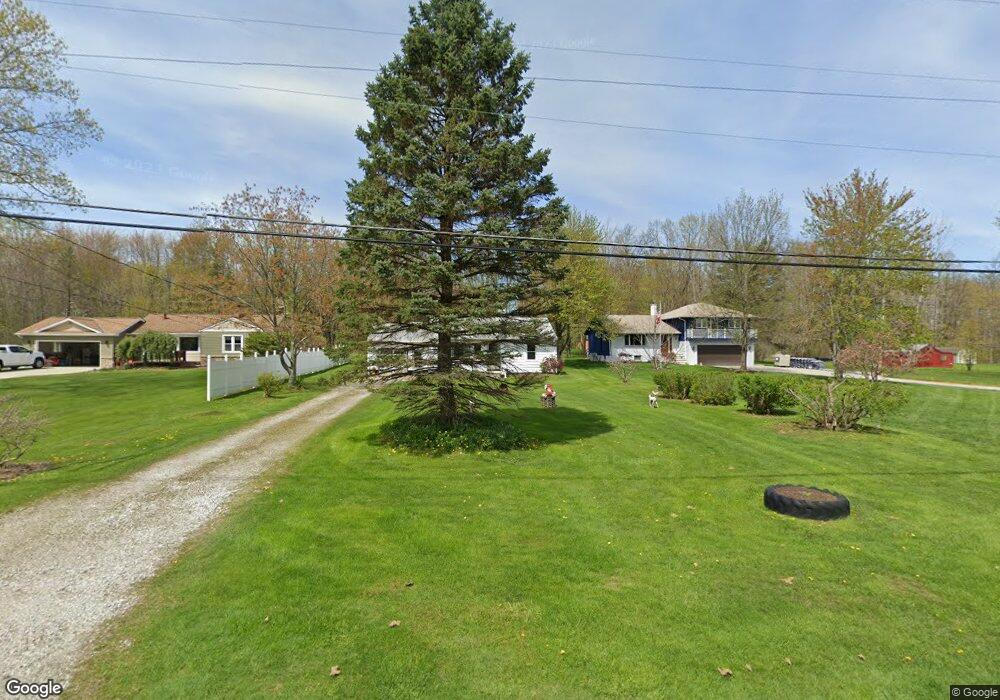
8450 Sharp Ln Chesterland, OH 44026
Estimated Value: $241,497 - $286,000
3
Beds
1
Bath
1,616
Sq Ft
$165/Sq Ft
Est. Value
About This Home
This home is located at 8450 Sharp Ln, Chesterland, OH 44026 and is currently estimated at $266,374, approximately $164 per square foot. 8450 Sharp Ln is a home located in Geauga County with nearby schools including West Geauga High School and St Anselm School.
Ownership History
Date
Name
Owned For
Owner Type
Purchase Details
Closed on
Jan 1, 1990
Bought by
Cooper Wilma Jean
Current Estimated Value
Create a Home Valuation Report for This Property
The Home Valuation Report is an in-depth analysis detailing your home's value as well as a comparison with similar homes in the area
Home Values in the Area
Average Home Value in this Area
Purchase History
| Date | Buyer | Sale Price | Title Company |
|---|---|---|---|
| Cooper Wilma Jean | -- | -- |
Source: Public Records
Tax History
| Year | Tax Paid | Tax Assessment Tax Assessment Total Assessment is a certain percentage of the fair market value that is determined by local assessors to be the total taxable value of land and additions on the property. | Land | Improvement |
|---|---|---|---|---|
| 2025 | $2,591 | $67,660 | $11,870 | $55,790 |
| 2024 | $2,591 | $67,660 | $11,870 | $55,790 |
| 2023 | $2,496 | $67,660 | $11,870 | $55,790 |
| 2022 | $1,865 | $47,080 | $9,870 | $37,210 |
| 2021 | $1,921 | $47,080 | $9,870 | $37,210 |
| 2020 | $1,997 | $47,080 | $9,870 | $37,210 |
| 2019 | $191 | $44,170 | $9,870 | $34,300 |
| 2018 | $1,790 | $42,210 | $9,870 | $32,340 |
| 2017 | $1,910 | $44,170 | $9,870 | $34,300 |
| 2016 | $1,569 | $36,260 | $9,450 | $26,810 |
| 2015 | $1,453 | $36,260 | $9,450 | $26,810 |
| 2014 | $1,453 | $36,260 | $9,450 | $26,810 |
| 2013 | $1,463 | $36,260 | $9,450 | $26,810 |
Source: Public Records
Map
Nearby Homes
- 8367 Kirkwood Dr
- 10831 Chillicothe Rd
- 10900 Angela Dr
- 10899 Tibbetts Rd
- 10405 Chillicothe Rd
- V/L Dewey Rd
- 7885 Pear Tree Dr
- 7425 Mulberry Rd
- 7454 Euclid Chardon Rd
- 10548 Briar Hill Dr
- 11765 Sherwood Trail
- 8583 Sherman Rd
- 8593 Sherman Rd
- 8301 Sherman Rd
- 8900 Eagle Rd
- 9735 Chillicothe Rd
- 9735 Chillicothe Rd Unit 29
- 9735 Chillicothe Rd Unit 30
- 8323 Eagle Rd Unit 52
- 8323 Eagle Rd Unit 44
Your Personal Tour Guide
Ask me questions while you tour the home.