Estimated Value: $102,000 - $172,000
3
Beds
1
Bath
999
Sq Ft
$129/Sq Ft
Est. Value
About This Home
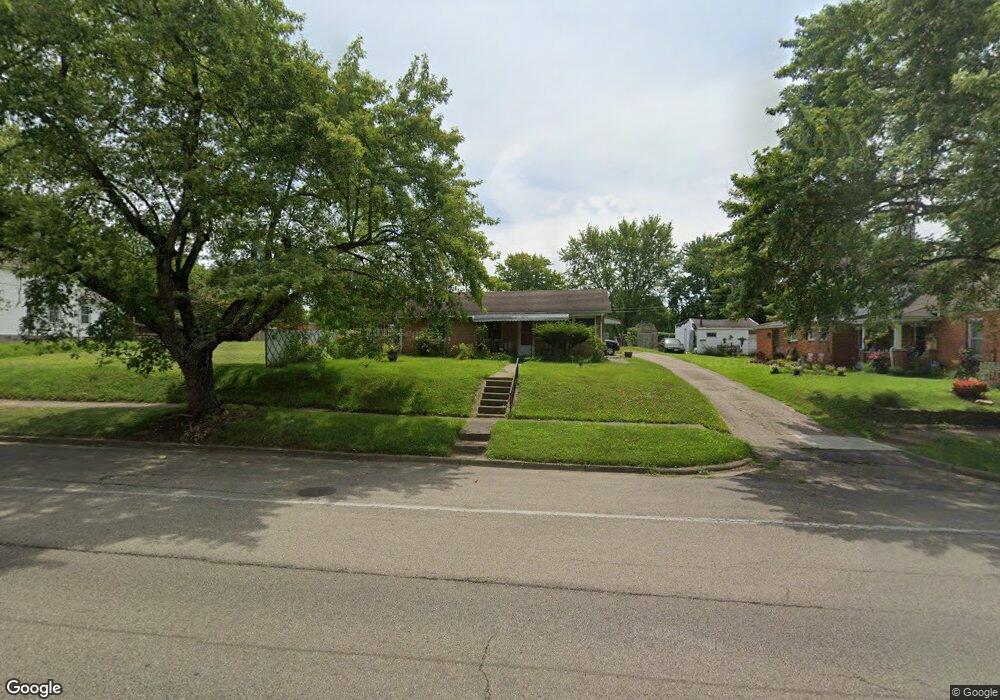
This home is located at 847 E Main St, Xenia, OH 45385 and is currently estimated at $129,183, approximately $129 per square foot. 847 E Main St is a home located in Greene County with nearby schools including Xenia High School, Summit Academy Community School for Alternative Learners - Xenia, and Legacy Christian Academy.
Ownership History
Date
Name
Owned For
Owner Type
Purchase Details
Closed on
Apr 6, 2021
Sold by
Jackson Norman E and Jackson Valerie R
Bought by
Jackson Norman E and Jackson Valerie R
Current Estimated Value
Purchase Details
Closed on
Sep 19, 2001
Sold by
Third Baptist Church
Bought by
Mcclendon Mary Ethelene
Purchase Details
Closed on
May 9, 1996
Sold by
Margaret E Parker Est
Bought by
Jackson Norman E and Jackson R
Home Financials for this Owner
Home Financials are based on the most recent Mortgage that was taken out on this home.
Original Mortgage
$43,700
Interest Rate
7.78%
Mortgage Type
New Conventional
Create a Home Valuation Report for This Property
The Home Valuation Report is an in-depth analysis detailing your home's value as well as a comparison with similar homes in the area
Home Values in the Area
Average Home Value in this Area
Purchase History
We collect this data history from publicly available records. To have your information removed, we recommend requesting removal directly through your county’s website.
| Date | Buyer | Sale Price | Title Company |
|---|---|---|---|
| Jackson Norman E | -- | None Listed On Document | |
| Mcclendon Mary Ethelene | $2,000 | -- | |
| Jackson Norman E | $46,000 | -- |
Source: Public Records
Mortgage History
We collect this data history from publicly available records. To have your information removed, we recommend requesting removal directly through your county’s website.
| Date | Status | Borrower | Loan Amount |
|---|---|---|---|
| Previous Owner | Jackson Norman E | $43,700 |
Source: Public Records
Tax History
| Year | Tax Paid | Tax Assessment Tax Assessment Total Assessment is a certain percentage of the fair market value that is determined by local assessors to be the total taxable value of land and additions on the property. | Land | Improvement |
|---|---|---|---|---|
| 2025 | $1,154 | $27,170 | $2,260 | $24,910 |
| 2024 | $1,154 | $27,170 | $2,260 | $24,910 |
| 2023 | $1,133 | $27,170 | $2,260 | $24,910 |
| 2022 | $946 | $19,340 | $2,060 | $17,280 |
| 2021 | $959 | $19,340 | $2,060 | $17,280 |
| 2020 | $918 | $19,340 | $2,060 | $17,280 |
| 2019 | $846 | $16,790 | $2,180 | $14,610 |
| 2018 | $850 | $16,790 | $2,180 | $14,610 |
| 2017 | $821 | $16,790 | $2,180 | $14,610 |
| 2016 | $830 | $16,100 | $2,180 | $13,920 |
| 2015 | $2,049 | $16,100 | $2,180 | $13,920 |
| 2014 | $280 | $16,100 | $2,180 | $13,920 |
Source: Public Records
Map
Nearby Homes
- 0 N Patton St
- 00 N Patton St
- 607 E Main St
- 0 E 2nd St
- 422 N Columbus St
- 573 Louise Dr
- 598 Louise Dr
- 603 Louise Dr
- 614 Louise Dr
- 149 Third
- 591 Kennedy St
- 617 Marshall Dr
- 286 Washington St
- 770 S Columbus St
- 75 W 2nd St
- 0 Gultice Rd Unit 955790
- 400 S Detroit St
- 300 N King St
- 119 S Galloway St
- 150-150 1/2 W Church St
Your Personal Tour Guide
Ask me questions while you tour the home.