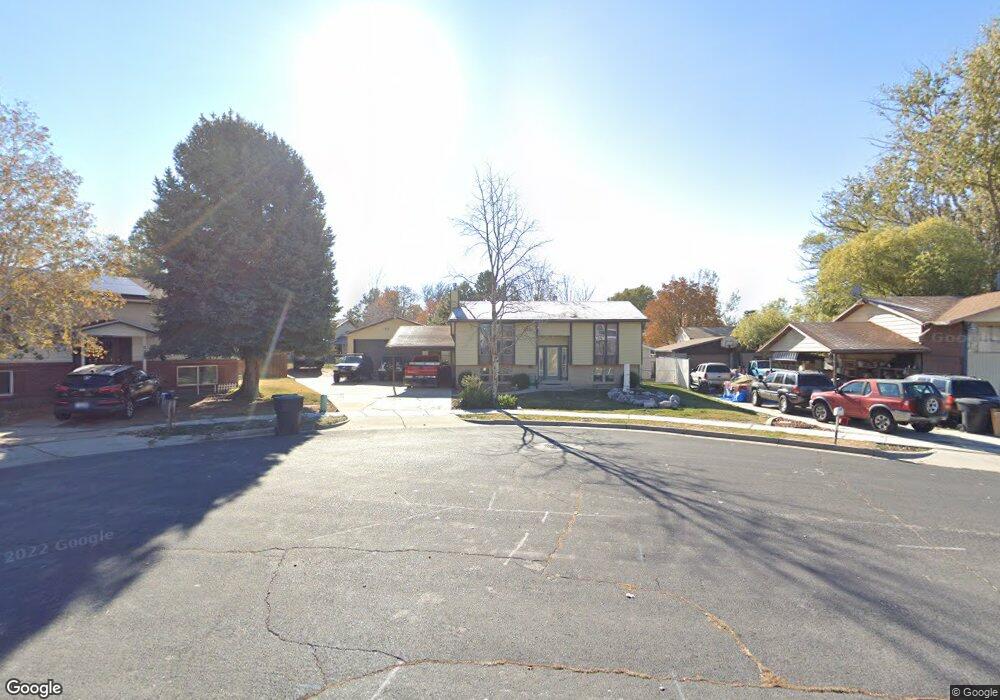
847 W 2600 N Clearfield, UT 84015
Estimated Value: $413,000 - $453,560
4
Beds
2
Baths
1,866
Sq Ft
$236/Sq Ft
Est. Value
About This Home
This home is located at 847 W 2600 N, Clearfield, UT 84015 and is currently estimated at $440,890, approximately $236 per square foot. 847 W 2600 N is a home located in Davis County with nearby schools including Fremont School, Sunset Junior High School, and Northridge High School.
Ownership History
Date
Name
Owned For
Owner Type
Purchase Details
Closed on
Mar 18, 2024
Sold by
Kay Johnson Living Trust
Bought by
Christensen Brenden A and Wagner Natalee I
Current Estimated Value
Home Financials for this Owner
Home Financials are based on the most recent Mortgage that was taken out on this home.
Original Mortgage
$459,523
Outstanding Balance
$450,076
Interest Rate
6.63%
Mortgage Type
FHA
Estimated Equity
-$9,186
Purchase Details
Closed on
Feb 2, 2023
Sold by
Johnson Kay L
Bought by
Kay Johnson Living Trust
Purchase Details
Closed on
Feb 25, 2008
Sold by
Johnson Bruce B and Johnson Kay L
Bought by
Johnson Bruce B and Johnson Kay L
Home Financials for this Owner
Home Financials are based on the most recent Mortgage that was taken out on this home.
Original Mortgage
$130,500
Interest Rate
5.64%
Mortgage Type
New Conventional
Purchase Details
Closed on
Jan 26, 2006
Sold by
Morlock Steven W and Morlock Susan F
Bought by
Johnson Bruce B and Davis Kay L
Home Financials for this Owner
Home Financials are based on the most recent Mortgage that was taken out on this home.
Original Mortgage
$26,000
Interest Rate
5.7%
Mortgage Type
Fannie Mae Freddie Mac
Purchase Details
Closed on
Oct 13, 1999
Sold by
Morlock Steven
Bought by
Morlock Steven W and Morlock Susan
Purchase Details
Closed on
Apr 15, 1999
Sold by
Morlock Steven W and Morlock Susan E
Bought by
Morlock Steven W and Morlock Susan E
Home Financials for this Owner
Home Financials are based on the most recent Mortgage that was taken out on this home.
Original Mortgage
$116,586
Interest Rate
6.65%
Mortgage Type
VA
Create a Home Valuation Report for This Property
The Home Valuation Report is an in-depth analysis detailing your home's value as well as a comparison with similar homes in the area
Home Values in the Area
Average Home Value in this Area
Purchase History
We collect this data history from publicly available records. To have your information removed, we recommend requesting removal directly through your county’s website.
| Date | Buyer | Sale Price | Title Company |
|---|---|---|---|
| Christensen Brenden A | -- | Trident Title | |
| Kay Johnson Living Trust | -- | -- | |
| Johnson Bruce B | -- | First American Title | |
| Johnson Bruce B | -- | Bonneville Title Company | |
| Morlock Steven W | -- | Security Title Company | |
| Morlock Steven W | -- | Security Title Company | |
| Morlock Steven W | -- | Security Title Company |
Source: Public Records
Mortgage History
We collect this data history from publicly available records. To have your information removed, we recommend requesting removal directly through your county’s website.
| Date | Status | Borrower | Loan Amount |
|---|---|---|---|
| Open | Christensen Brenden A | $459,523 | |
| Previous Owner | Johnson Bruce B | $130,500 | |
| Previous Owner | Johnson Bruce B | $26,000 | |
| Previous Owner | Johnson Bruce B | $104,000 | |
| Previous Owner | Morlock Steven W | $116,586 |
Source: Public Records
Tax History
| Year | Tax Paid | Tax Assessment Tax Assessment Total Assessment is a certain percentage of the fair market value that is determined by local assessors to be the total taxable value of land and additions on the property. | Land | Improvement |
|---|---|---|---|---|
| 2025 | $2,271 | $218,350 | $96,265 | $122,085 |
| 2024 | $2,122 | $205,150 | $105,671 | $99,479 |
| 2023 | $1,867 | $334,000 | $120,479 | $213,521 |
| 2022 | $1,957 | $193,600 | $73,390 | $120,210 |
| 2021 | $1,765 | $259,000 | $92,395 | $166,605 |
| 2020 | $1,522 | $221,000 | $78,785 | $142,215 |
| 2019 | $1,487 | $211,000 | $91,556 | $119,444 |
| 2018 | $1,334 | $186,000 | $77,266 | $108,734 |
| 2016 | $1,157 | $83,271 | $30,146 | $53,125 |
| 2015 | $1,127 | $77,111 | $30,146 | $46,965 |
| 2014 | $1,162 | $80,827 | $30,146 | $50,681 |
| 2013 | -- | $76,657 | $25,230 | $51,427 |
Source: Public Records
Map
Nearby Homes
Your Personal Tour Guide
Ask me questions while you tour the home.