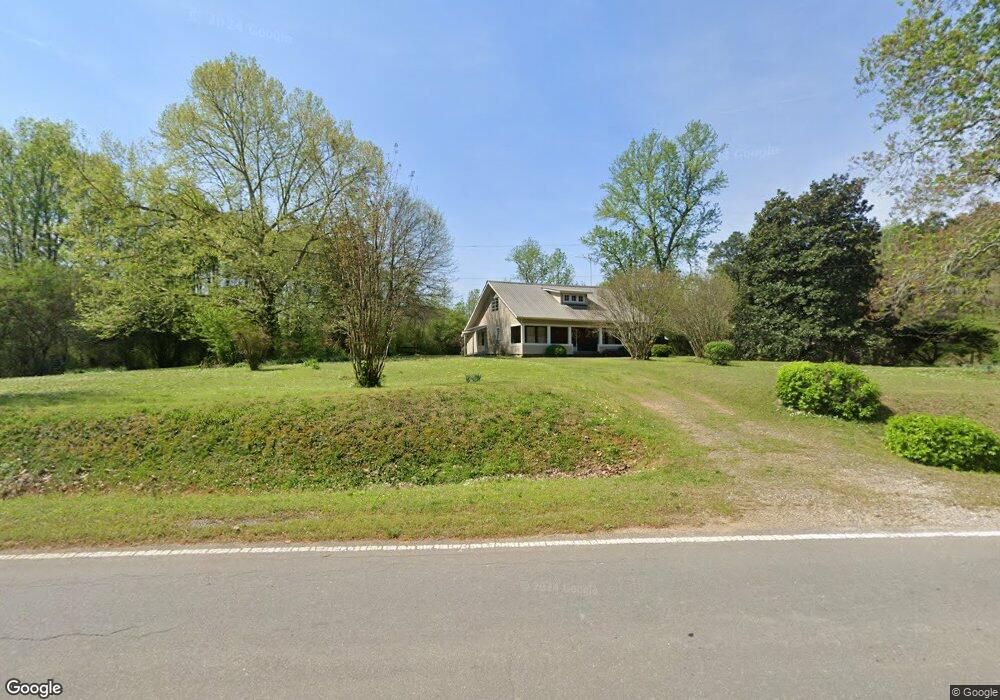
8471 Blacks Bluff Rd SW Cave Spring, GA 30124
Estimated Value: $186,360 - $287,000
Studio
--
Bath
1,484
Sq Ft
$162/Sq Ft
Est. Value
About This Home
This home is located at 8471 Blacks Bluff Rd SW, Cave Spring, GA 30124 and is currently estimated at $239,840, approximately $161 per square foot. 8471 Blacks Bluff Rd SW is a home located in Floyd County with nearby schools including Coosa Middle School and Coosa High School.
Ownership History
Date
Name
Owned For
Owner Type
Purchase Details
Closed on
Jan 9, 2024
Sold by
Cook Glenda Faye
Bought by
Ely Sandra Faye
Current Estimated Value
Purchase Details
Closed on
Jul 11, 2023
Sold by
Cook Glenda Faye
Bought by
Ely Sandra Faye
Purchase Details
Closed on
Apr 19, 2002
Bought by
P and R
Purchase Details
Closed on
Aug 24, 2001
Bought by
P and R
Purchase Details
Closed on
Aug 14, 2001
Sold by
Dover Byron Cecil
Bought by
Cook Bobby Lee and Glenda Faye Cook
Purchase Details
Closed on
Jun 14, 1991
Sold by
Wingo Bruce and Joan Porter
Bought by
Dover Byron Cecil
Purchase Details
Closed on
Feb 2, 1976
Bought by
P and R
Purchase Details
Closed on
Feb 1, 1976
Sold by
Dempsey Thomas E and Barbara Ann
Bought by
Wingo Bruce and Joan Porter
Purchase Details
Closed on
Jun 25, 1969
Bought by
P and R
Purchase Details
Closed on
Jun 24, 1969
Sold by
Kerr John H
Bought by
Dempsey Thomas E and Barbara Ann
Purchase Details
Closed on
Jan 1, 1953
Bought by
Kerr John H
Create a Home Valuation Report for This Property
The Home Valuation Report is an in-depth analysis detailing your home's value as well as a comparison with similar homes in the area
Purchase History
| Date | Buyer | Sale Price | Title Company |
|---|---|---|---|
| Ely Sandra Faye | -- | -- | |
| Ely Sandra Faye | -- | -- | |
| P | -- | -- | |
| P | -- | -- | |
| Cook Bobby Lee | $52,000 | -- | |
| Dover Byron Cecil | $37,000 | -- | |
| P | -- | -- | |
| Wingo Bruce | $12,000 | -- | |
| P | -- | -- | |
| Dempsey Thomas E | $6,000 | -- | |
| Kerr John H | -- | -- |
Source: Public Records
Tax History
| Year | Tax Paid | Tax Assessment Tax Assessment Total Assessment is a certain percentage of the fair market value that is determined by local assessors to be the total taxable value of land and additions on the property. | Land | Improvement |
|---|---|---|---|---|
| 2025 | $1,740 | $70,153 | $9,905 | $60,248 |
| 2024 | $1,740 | $63,972 | $8,804 | $55,168 |
| 2023 | $1,830 | $54,888 | $8,004 | $46,884 |
| 2022 | $1,135 | $38,245 | $6,541 | $31,704 |
| 2021 | $946 | $31,356 | $5,964 | $25,392 |
| 2020 | $883 | $29,010 | $5,186 | $23,824 |
| 2019 | $824 | $27,442 | $5,186 | $22,256 |
| 2018 | $770 | $25,582 | $4,939 | $20,643 |
| 2017 | $732 | $24,275 | $4,573 | $19,702 |
| 2016 | $620 | $20,303 | $4,560 | $15,743 |
| 2015 | $606 | $20,303 | $4,560 | $15,743 |
| 2014 | $606 | $20,303 | $4,560 | $15,743 |
Source: Public Records
Map
Nearby Homes
- 8203 Blacks Bluff Rd SW
- 8126 Blacks Bluff Rd SW
- 8096 Blacks Bluff Rd SW
- 0 George Rd SW Unit 26764136
- 0 George Rd SW Unit 10567389
- 0 George Rd SW Unit 7618177
- 450 County Road 803
- Lot 19 County Road 803
- 7138 Blacks Bluff Rd SW
- 0 Blacks Bluff Rd SW Unit 10677033
- 7112 Blacks Bluff Rd SW
- 825 County Road 486
- Lot 29 County Road 789 Unit Lot 29
- 175 County Road 783
- 1685 County Road 182 SW
- 6902 Blacks Bluff Rd SW
- 0 County Road 22 Unit 21441574
- 0 County Road 22 Unit 26078035
- 11 County Road 182
- Lots 41- 42 County Road 182
- 8461 Blacks Bluff Rd SW
- 8421 Blacks Bluff Rd SW
- 8421 Blacks Bluff Rd SW
- 8477 Blacks Bluff Rd SW
- 8375 Blacks Bluff Rd SW
- 8336 Blacks Bluff Rd SW
- 8275 Blacks Bluff Rd SW
- 8731 Blacks Bluff Rd SW
- 8733 Blacks Bluff Rd SW
- 204 George Rd SW
- 8681 Blacks Bluff Rd SW
- 8697 Blacks Bluff Rd SW
- 190 George Rd SW Unit 10/12
- 198 George Rd SW
- 8208 Blacks Bluff Rd SW
- 116 George Rd SW
- 78 George Rd SW
- 106 George Rd SW
- 8334 Blacks Bluff Rd SW
- 8162 Blacks Bluff Rd SW
Your Personal Tour Guide
Ask me questions while you tour the home.