849 Illges Rd Columbus, GA 31906
Carver Heights NeighborhoodEstimated Value: $86,000 - $136,000
About This Home
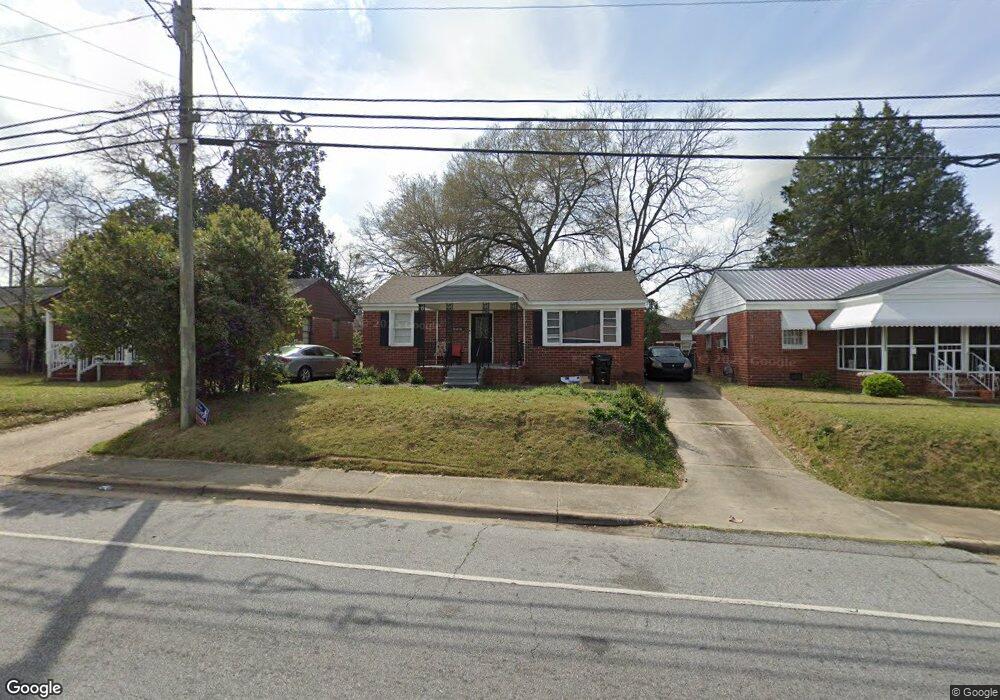
This home is located at 849 Illges Rd, Columbus, GA 31906 and is currently estimated at $117,814, approximately $119 per square foot. 849 Illges Rd is a home located in Muscogee County with nearby schools including Dorothy Height Elementary School, Rothschild Leadership Academy, and Carver High School.
Ownership History
We collect this data history from publicly available records. To have your information removed, we recommend requesting removal directly through your county’s website.
Purchase Details
Home Financials for this Owner
Home Financials are based on the most recent Mortgage that was taken out on this home.Purchase Details
Home Financials for this Owner
Home Financials are based on the most recent Mortgage that was taken out on this home.Purchase Details
Purchase Details
Home Values in the Area
Average Home Value in this Area
Purchase History
We collect this data history from publicly available records. To have your information removed, we recommend requesting removal directly through your county’s website.
| Date | Buyer | Sale Price | Title Company |
|---|---|---|---|
| -- | None Listed On Document | ||
| $122,000 | None Listed On Document | ||
| $15,000 | None Listed On Document | ||
| -- | -- |
Mortgage History
We collect this data history from publicly available records. To have your information removed, we recommend requesting removal directly through your county’s website.
| Date | Status | Borrower | Loan Amount |
|---|---|---|---|
| Open | $97,600 |
Tax History
We collect this data history from publicly available records. To have your information removed, we recommend requesting removal directly through your county’s website.
| Year | Tax Paid | Tax Assessment Tax Assessment Total Assessment is a certain percentage of the fair market value that is determined by local assessors to be the total taxable value of land and additions on the property. | Land | Improvement |
|---|---|---|---|---|
| 2025 | $1,926 | $49,200 | $3,580 | $45,620 |
| 2024 | $1,079 | $27,576 | $3,580 | $23,996 |
| 2023 | $842 | $21,364 | $3,580 | $17,784 |
| 2022 | $787 | $19,268 | $3,580 | $15,688 |
| 2021 | $839 | $18,428 | $3,580 | $14,848 |
| 2020 | $753 | $18,428 | $3,580 | $14,848 |
| 2019 | $3 | $18,428 | $3,580 | $14,848 |
| 2018 | $3 | $18,428 | $3,580 | $14,848 |
| 2017 | $9 | $18,428 | $3,580 | $14,848 |
| 2016 | $5 | $12,894 | $2,072 | $10,822 |
| 2015 | $2 | $12,894 | $2,072 | $10,822 |
| 2014 | $2 | $12,894 | $2,072 | $10,822 |
| 2013 | -- | $12,894 | $2,072 | $10,822 |
Map
- 3022 Baldwin St
- 930 Charleston Ave
- 944 Booker Ave
- 961 Illges Rd
- 3403 Terminal Ct
- 3027 Colorado St
- 3319 Decatur St
- 831 Rigdon Rd
- 764 Terminal Ct
- 2918 9th St
- 770 Terminal Ct
- 1035 Fisk Ave
- 3035 Morehouse St
- 2833 Thomas St
- 2831 Thomas St
- 2829 Thomas St
- 2740 9th St
- 2829 Hood St
- 2122 8th St
- 1072 Rigdon Rd
Ask me questions while you tour the home.