B
Landlord's Agent in 2024
Bridget Lyden
William Raveis Real Estate
(203) 968-1388
6 Total Sales
Estimated Value: $490,000 - $558,000
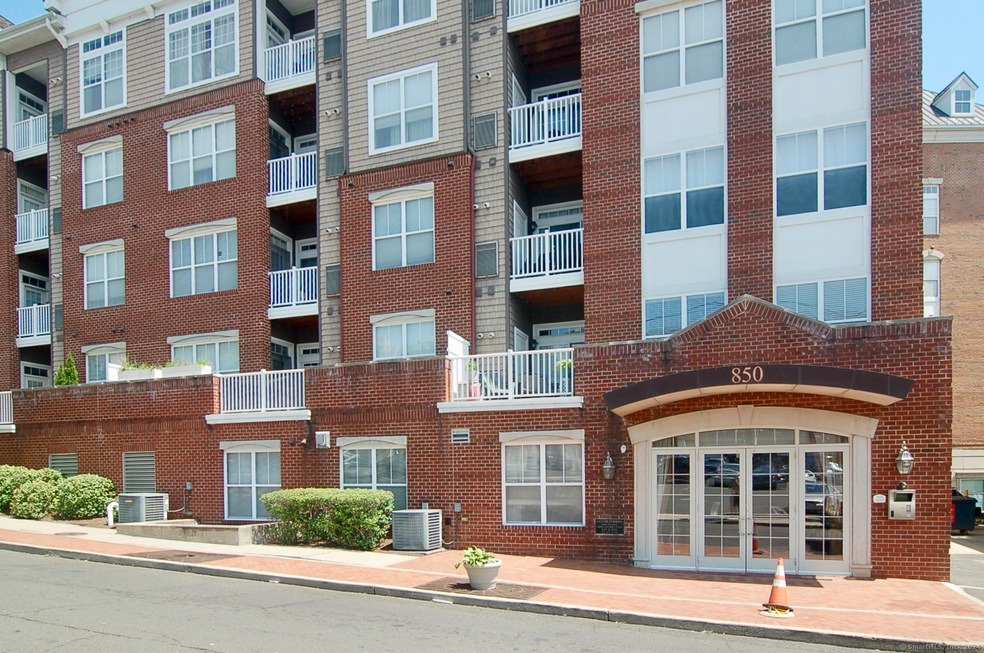
Beautiful and well maintained 2 Bedrooms, 2 Full Baths, has great contemporary open floor plan with island style kitchen, and hardwood floors throughout, has concierge on premises Mon - Fr 9-5. Ground level overlooking courtyard available for cookouts and get togethers, Has it own community room and exercise room, Walk to shops and right on the bus line, 2parking spots, 1 designated #56, perfect for commuters, Owner requests excellent credit
Last Agent to Rent the Property
William Raveis Real Estate License #RES.0757986 Listed on: 07/26/2024

| Date | Buyer | Sale Price | Title Company |
|---|---|---|---|
| Twu Cynthia | $375,000 | None Available | |
| Sweeney Timothy | $423,100 | -- |
| Date | Status | Borrower | Loan Amount |
|---|---|---|---|
| Open | Twu Cynthia | $281,250 | |
| Previous Owner | Sweeney Timothy | $368,800 | |
| Previous Owner | Sweeney Timothy | $380,844 |
| Date | Event | Price | List to Sale | Price per Sq Ft |
|---|---|---|---|---|
| 08/26/2024 08/26/24 | Rented | $3,000 | 0.0% | -- |
| 08/19/2024 08/19/24 | Under Contract | -- | -- | -- |
| 07/26/2024 07/26/24 | For Rent | $3,000 | -- | -- |
| Year | Tax Paid | Tax Assessment Tax Assessment Total Assessment is a certain percentage of the fair market value that is determined by local assessors to be the total taxable value of land and additions on the property. | Land | Improvement |
|---|---|---|---|---|
| 2025 | $6,777 | $283,340 | $0 | $283,340 |
| 2024 | $6,619 | $283,340 | $0 | $283,340 |
| 2023 | $6,847 | $271,260 | $0 | $271,260 |
| 2022 | $6,577 | $242,070 | $0 | $242,070 |
| 2021 | $6,521 | $242,070 | $0 | $242,070 |
| 2020 | $6,379 | $242,070 | $0 | $242,070 |
| 2019 | $6,379 | $242,070 | $0 | $242,070 |
| 2018 | $6,180 | $242,070 | $0 | $242,070 |
| 2017 | $5,773 | $214,690 | $0 | $214,690 |
| 2016 | $5,608 | $214,690 | $0 | $214,690 |
| 2015 | $5,460 | $214,690 | $0 | $214,690 |
| 2014 | $5,322 | $214,690 | $0 | $214,690 |
B
Landlord's Agent in 2024
Bridget Lyden
William Raveis Real Estate
(203) 968-1388
6 Total Sales
Tenant's Agent in 2024
Emmanuel Benavidez
Higgins Group Real Estate
(475) 292-9821
1 in this area
1 Total Sale
Source: SmartMLS
MLS Number: 24035458
APN: STAM-000004-000000-004592-UT000220
Disclaimer: Certain information contained herein is derived from information provided by parties other than Homes.com. All information provided is deemed reliable, but is not guaranteed to be accurate and should be independently verified.
![]() IDX information is provided exclusively for personal, non-commercial use, and may not be used for any purpose other than to identify prospective properties consumers may be interested in purchasing. Information is deemed reliable but not guaranteed.
IDX information is provided exclusively for personal, non-commercial use, and may not be used for any purpose other than to identify prospective properties consumers may be interested in purchasing. Information is deemed reliable but not guaranteed.
Ask me questions while you tour the home.