855 High St Houma, LA 70360
South Side NeighborhoodEstimated Value: $264,128 - $424,000
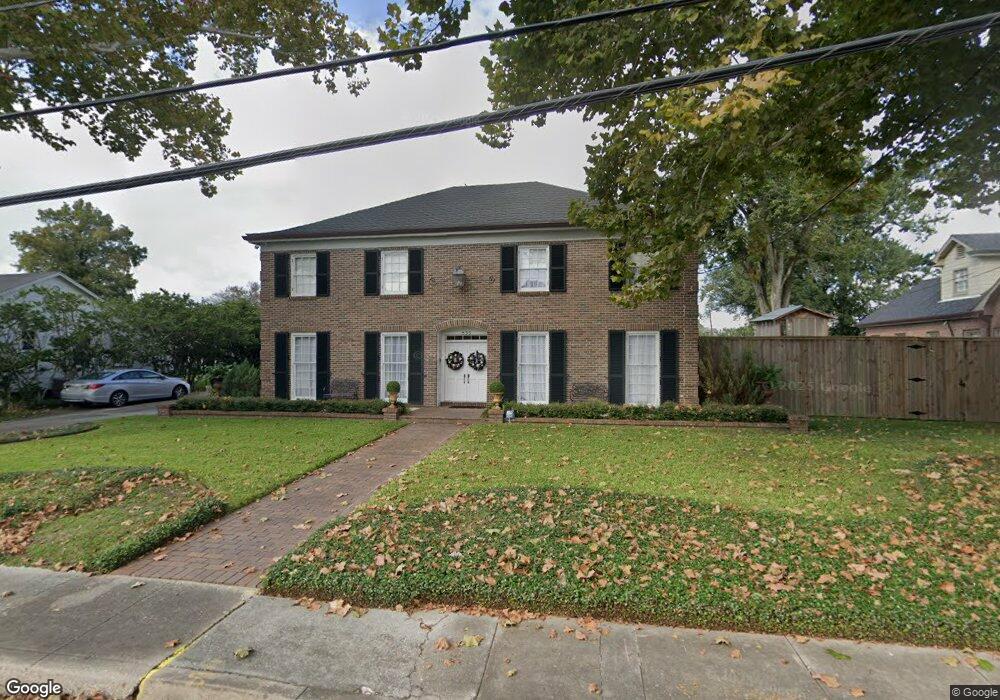
About This Home
This home is located at 855 High St, Houma, LA 70360 and is currently estimated at $324,532, approximately $81 per square foot. 855 High St is a home located in Terrebonne Parish with nearby schools including Southdown Elementary School, Houma Junior High School, and Terrebonne High School.
Ownership History
We collect this data history from publicly available records. To have your information removed, we recommend requesting removal directly through your county’s website.
Purchase Details
Home Financials for this Owner
Home Financials are based on the most recent Mortgage that was taken out on this home.Home Values in the Area
Average Home Value in this Area
Purchase History
We collect this data history from publicly available records. To have your information removed, we recommend requesting removal directly through your county’s website.
| Date | Buyer | Sale Price | Title Company |
|---|---|---|---|
| $300,000 | Attorney |
Mortgage History
We collect this data history from publicly available records. To have your information removed, we recommend requesting removal directly through your county’s website.
| Date | Status | Borrower | Loan Amount |
|---|---|---|---|
| Open | $240,000 |
Tax History
We collect this data history from publicly available records. To have your information removed, we recommend requesting removal directly through your county’s website.
| Year | Tax Paid | Tax Assessment Tax Assessment Total Assessment is a certain percentage of the fair market value that is determined by local assessors to be the total taxable value of land and additions on the property. | Land | Improvement |
|---|---|---|---|---|
| 2025 | $1,559 | $23,230 | $7,080 | $16,150 |
| 2024 | $1,559 | $23,230 | $7,080 | $16,150 |
| 2023 | $1,593 | $22,120 | $6,740 | $15,380 |
| 2022 | $1,449 | $22,120 | $6,740 | $15,380 |
| 2021 | $1,280 | $20,580 | $6,740 | $13,840 |
| 2020 | $1,880 | $22,120 | $6,740 | $15,380 |
| 2019 | $1,956 | $21,240 | $5,860 | $15,380 |
| 2018 | $1,318 | $20,225 | $5,580 | $14,645 |
| 2017 | $1,891 | $20,225 | $5,580 | $14,645 |
| 2015 | $959 | $20,225 | $5,580 | $14,645 |
| 2014 | $1,320 | $20,225 | $0 | $0 |
| 2013 | $1,322 | $20,225 | $0 | $0 |
Map
- 813 Wood St
- 1118 Academy St
- 855 Verret St
- 1002 Aycock St
- 815 School St
- 822 Belanger St
- 913 Liberty St
- 900 Belanger St
- 631 Verret St
- 629 Verret St
- 883 Centurion Ln
- 1301 & 1301 1/2 Bourg St
- 1133 Daspit St
- 1306 Lee Ave
- 1170 Barrow St
- 1315 Center St
- 1176 Barrow St
- 1124 Schley St
- 1128 Schley St
- 1409 Lee Ave
Ask me questions while you tour the home.