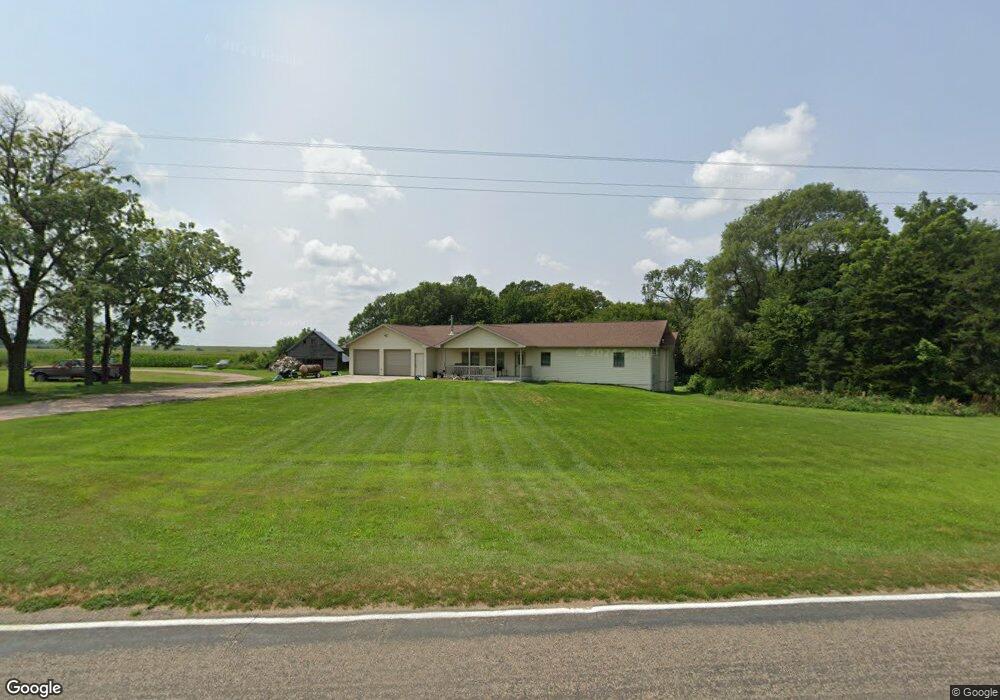
85847 536 Ave Plainview, NE 68769
Estimated Value: $46,000 - $408,000
3
Beds
2
Baths
1,950
Sq Ft
$146/Sq Ft
Est. Value
About This Home
This home is located at 85847 536 Ave, Plainview, NE 68769 and is currently estimated at $283,988, approximately $145 per square foot. 85847 536 Ave is a home with nearby schools including Plainview Elementary School and Plainview Secondary School.
Ownership History
Date
Name
Owned For
Owner Type
Purchase Details
Closed on
Apr 22, 2022
Sold by
Bugay Melissa L and Knaak 7 Robert F & Kristi L
Bought by
Eichberger John D and Eichberger Jessica E
Current Estimated Value
Purchase Details
Closed on
Jan 4, 2017
Sold by
Eichberger Randall L and Eichberger Alene A
Bought by
Eichberger John and Eichberger Jessica
Home Financials for this Owner
Home Financials are based on the most recent Mortgage that was taken out on this home.
Original Mortgage
$200,000
Interest Rate
4.13%
Mortgage Type
New Conventional
Create a Home Valuation Report for This Property
The Home Valuation Report is an in-depth analysis detailing your home's value as well as a comparison with similar homes in the area
Purchase History
| Date | Buyer | Sale Price | Title Company |
|---|---|---|---|
| Eichberger John D | $143,000 | Title Services Of The Plains | |
| Eichberger John | $250,000 | None Available |
Source: Public Records
Mortgage History
| Date | Status | Borrower | Loan Amount |
|---|---|---|---|
| Previous Owner | Eichberger John | $200,000 |
Source: Public Records
Tax History
| Year | Tax Paid | Tax Assessment Tax Assessment Total Assessment is a certain percentage of the fair market value that is determined by local assessors to be the total taxable value of land and additions on the property. | Land | Improvement |
|---|---|---|---|---|
| 2025 | $1,387 | $256,425 | $33,900 | $222,525 |
| 2024 | $1,676 | $293,785 | $33,900 | $259,885 |
| 2023 | $2,532 | $280,330 | $27,830 | $252,500 |
| 2022 | $2,809 | $274,620 | $22,120 | $252,500 |
| 2021 | $2,592 | $274,620 | $22,120 | $252,500 |
| 2020 | $2,576 | $262,900 | $22,120 | $240,780 |
| 2019 | $2,625 | $273,100 | $16,060 | $257,040 |
| 2018 | $2,410 | $250,310 | $16,060 | $234,250 |
| 2017 | $2,234 | $230,460 | $13,560 | $216,900 |
| 2016 | $309 | $32,995 | $13,560 | $19,435 |
| 2015 | $269 | $32,995 | $13,560 | $19,435 |
| 2014 | $410 | $46,425 | $13,560 | $32,865 |
Source: Public Records
Map
Nearby Homes
Your Personal Tour Guide
Ask me questions while you tour the home.