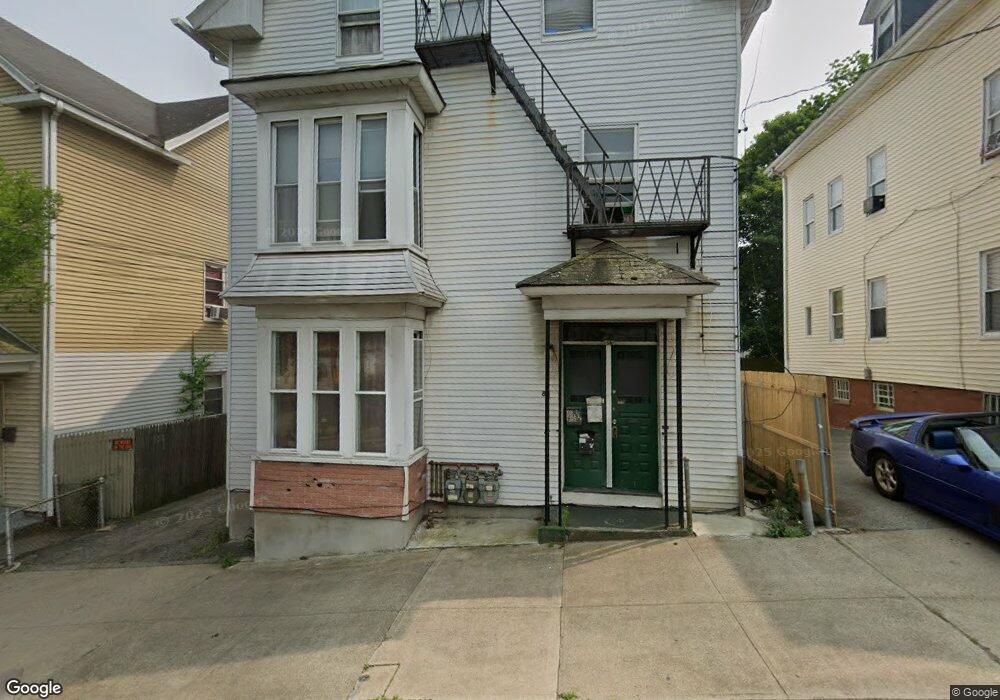
86 Newark St Providence, RI 02908
Olneyville NeighborhoodEstimated Value: $515,000 - $693,000
About This Home
This home is located at 86 Newark St, Providence, RI 02908 and is currently estimated at $625,667, approximately $215 per square foot. 86 Newark St is a home located in Providence County with nearby schools including Paul Cuffee Charter School, Blessed Sacrament School, and Holy Ghost School.
Ownership History
We collect this data history from publicly available records. To have your information removed, we recommend requesting removal directly through your county’s website.
Purchase Details
Purchase Details
Home Financials for this Owner
Home Financials are based on the most recent Mortgage that was taken out on this home.Purchase Details
Home Values in the Area
Average Home Value in this Area
Purchase History
We collect this data history from publicly available records. To have your information removed, we recommend requesting removal directly through your county’s website.
| Date | Buyer | Sale Price | Title Company |
|---|---|---|---|
| -- | -- | ||
| -- | -- | ||
| $55,000 | -- | ||
| $115,000 | -- |
Mortgage History
We collect this data history from publicly available records. To have your information removed, we recommend requesting removal directly through your county’s website.
| Date | Status | Borrower | Loan Amount |
|---|---|---|---|
| Previous Owner | $57,000 | ||
| Previous Owner | $115,000 | ||
| Previous Owner | $47,100 |
Tax History
We collect this data history from publicly available records. To have your information removed, we recommend requesting removal directly through your county’s website.
| Year | Tax Paid | Tax Assessment Tax Assessment Total Assessment is a certain percentage of the fair market value that is determined by local assessors to be the total taxable value of land and additions on the property. | Land | Improvement |
|---|---|---|---|---|
| 2025 | $6,635 | $473,900 | $111,700 | $362,200 |
| 2024 | $5,711 | $311,200 | $67,800 | $243,400 |
| 2023 | $5,711 | $311,200 | $67,800 | $243,400 |
| 2022 | $5,539 | $311,200 | $67,800 | $243,400 |
| 2021 | $4,914 | $200,100 | $45,600 | $154,500 |
| 2020 | $4,914 | $200,100 | $45,600 | $154,500 |
| 2019 | $4,914 | $200,100 | $45,600 | $154,500 |
| 2018 | $3,950 | $123,600 | $35,900 | $87,700 |
| 2017 | $3,950 | $123,600 | $35,900 | $87,700 |
| 2016 | $3,950 | $123,600 | $35,900 | $87,700 |
| 2015 | $3,724 | $112,500 | $44,200 | $68,300 |
| 2014 | $3,797 | $112,500 | $44,200 | $68,300 |
| 2013 | $3,797 | $112,500 | $44,200 | $68,300 |
Map
- 789 Atwells Ave
- 787 Atwells Ave
- 5844 Newark St
- 781 Atwells Ave
- 14 Academy Ave
- 92 Newark St
- 20 Academy Ave
- 10 Academy Ave
- 775 Atwells Ave
- 777 Atwells Ave
- 90 Newark St
- 16 Academy Ave Unit 20
- 4 Academy Ave
- 95 Newark St
- 26 Academy Ave
- 786 Atwells Ave
- 771 Atwells Ave
- 29 Academy Ave
- 788 Atwells Ave
- 159 Putnam St
Ask me questions while you tour the home.