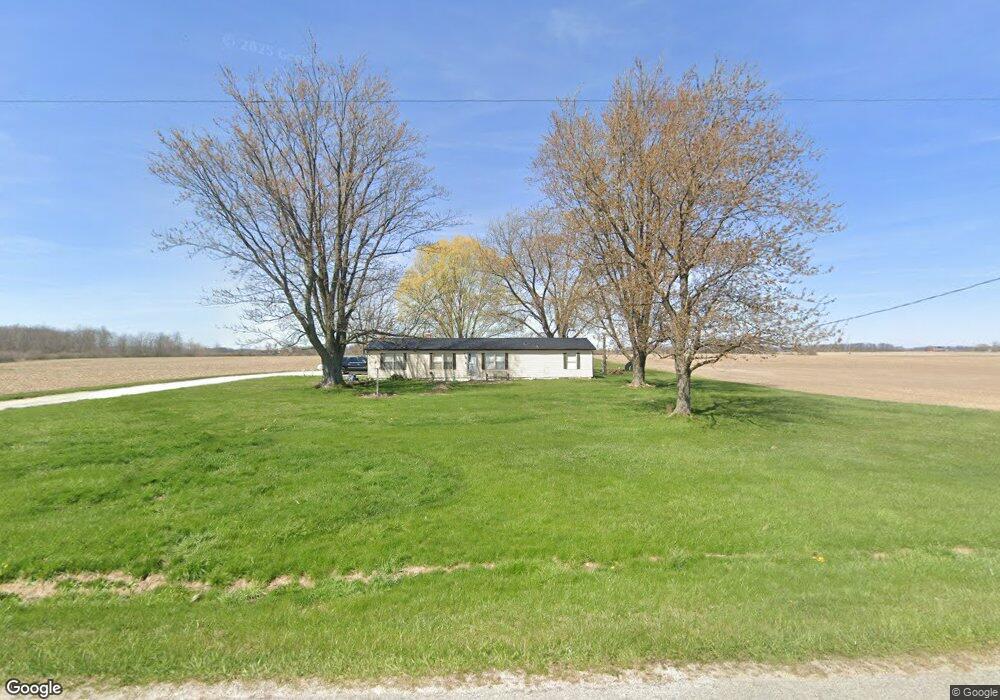
8611 E 125 N Marion, IN 46952
Estimated Value: $118,855 - $181,000
3
Beds
2
Baths
1,403
Sq Ft
$111/Sq Ft
Est. Value
About This Home
This home is located at 8611 E 125 N, Marion, IN 46952 and is currently estimated at $156,214, approximately $111 per square foot. 8611 E 125 N is a home located in Grant County.
Ownership History
Date
Name
Owned For
Owner Type
Purchase Details
Closed on
Oct 21, 2015
Sold by
Burry Anna M
Bought by
Burry Eric W and Burry Anna M
Current Estimated Value
Purchase Details
Closed on
Oct 29, 2010
Sold by
Castillo Keith M and Castillo Lois
Bought by
Burry Anna M
Home Financials for this Owner
Home Financials are based on the most recent Mortgage that was taken out on this home.
Original Mortgage
$71,536
Outstanding Balance
$46,219
Interest Rate
4.25%
Mortgage Type
FHA
Estimated Equity
$109,995
Purchase Details
Closed on
Jul 26, 2007
Sold by
Belcher Jesse R and Belcher Victoria L
Bought by
Equit Credit Corpporation Of America
Create a Home Valuation Report for This Property
The Home Valuation Report is an in-depth analysis detailing your home's value as well as a comparison with similar homes in the area
Purchase History
We collect this data history from publicly available records. To have your information removed, we recommend requesting removal directly through your county’s website.
| Date | Buyer | Sale Price | Title Company |
|---|---|---|---|
| Burry Eric W | -- | None Available | |
| Burry Anna M | -- | None Available | |
| Equit Credit Corpporation Of America | $29,989 | None Available |
Source: Public Records
Mortgage History
We collect this data history from publicly available records. To have your information removed, we recommend requesting removal directly through your county’s website.
| Date | Status | Borrower | Loan Amount |
|---|---|---|---|
| Open | Burry Anna M | $71,536 |
Source: Public Records
Tax History
| Year | Tax Paid | Tax Assessment Tax Assessment Total Assessment is a certain percentage of the fair market value that is determined by local assessors to be the total taxable value of land and additions on the property. | Land | Improvement |
|---|---|---|---|---|
| 2025 | $395 | $71,200 | $25,700 | $45,500 |
| 2024 | $453 | $79,300 | $26,400 | $52,900 |
| 2023 | $354 | $77,800 | $24,800 | $53,000 |
| 2022 | $270 | $65,600 | $23,200 | $42,400 |
| 2021 | $319 | $62,100 | $22,300 | $39,800 |
| 2020 | $296 | $60,100 | $22,300 | $37,800 |
| 2019 | $304 | $61,900 | $23,400 | $38,500 |
| 2018 | $253 | $65,700 | $23,600 | $42,100 |
| 2017 | $249 | $65,000 | $24,600 | $40,400 |
| 2016 | $244 | $65,500 | $25,100 | $40,400 |
| 2014 | $254 | $66,300 | $25,400 | $40,900 |
| 2013 | $254 | $64,900 | $24,200 | $40,700 |
Source: Public Records
Map
Nearby Homes
Your Personal Tour Guide
Ask me questions while you tour the home.