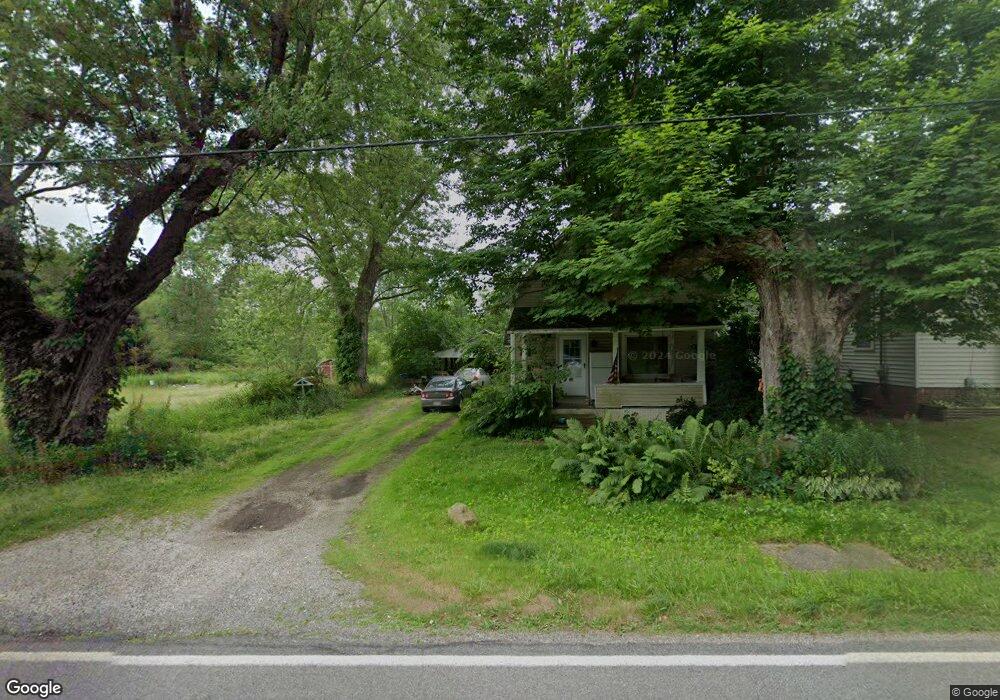
8636 Mapleton St SE East Canton, OH 44730
Estimated Value: $51,000 - $183,000
2
Beds
1
Bath
792
Sq Ft
$157/Sq Ft
Est. Value
About This Home
This home is located at 8636 Mapleton St SE, East Canton, OH 44730 and is currently estimated at $124,402, approximately $157 per square foot. 8636 Mapleton St SE is a home located in Stark County with nearby schools including East Canton Elementary School, East Canton Middle School, and East Canton High School.
Ownership History
Date
Name
Owned For
Owner Type
Purchase Details
Closed on
Aug 17, 2010
Sold by
Kantorik Mary Ann
Bought by
Kantorik Theresa A
Current Estimated Value
Purchase Details
Closed on
Aug 10, 2007
Sold by
Estate Of Mervin A Kantorik
Bought by
Kantorik Mary Ann
Purchase Details
Closed on
Jul 31, 2007
Sold by
Kantorik Mary Ann
Bought by
Kantorik Mary Ann and Kantorik Robert R
Create a Home Valuation Report for This Property
The Home Valuation Report is an in-depth analysis detailing your home's value as well as a comparison with similar homes in the area
Purchase History
| Date | Buyer | Sale Price | Title Company |
|---|---|---|---|
| Kantorik Theresa A | -- | None Available | |
| Kantorik Mary Ann | -- | None Available | |
| Kantorik Mary Ann | -- | Attorney |
Source: Public Records
Tax History
| Year | Tax Paid | Tax Assessment Tax Assessment Total Assessment is a certain percentage of the fair market value that is determined by local assessors to be the total taxable value of land and additions on the property. | Land | Improvement |
|---|---|---|---|---|
| 2025 | -- | $21,460 | $3,850 | $17,610 |
| 2024 | -- | $21,460 | $3,850 | $17,610 |
| 2023 | $669 | $17,750 | $2,800 | $14,950 |
| 2022 | $657 | $17,750 | $2,800 | $14,950 |
| 2021 | $660 | $17,750 | $2,800 | $14,950 |
| 2020 | $608 | $14,880 | $2,560 | $12,320 |
| 2019 | $416 | $14,900 | $2,560 | $12,340 |
Source: Public Records
Map
Nearby Homes
- 0000 Ravenna Chapel Ave SE
- 8155 Westfall St SE
- 10400 Lincoln St SE
- 7091 Bluebird Rd NW Unit 2W
- 3929 Robertsville Ave SE
- 0 Lincoln St SE Unit 5157308
- 0 Lincoln St SE Unit 5157344
- 11304 Peachlane St SE
- 11294 Lincoln St SE
- 6805 Waynesburg Dr SE
- 8114 Lisbon St E
- 226 Liberty St E
- 318 Wood St N
- 231 Cedar St N
- 137 Noble St W
- 403 Nassau St W
- 4293 Legend Rd NW
- 2425 Miday Ave NE
- 5147 Bluebird Rd NW
- 8038 Avalon Rd NW
- 8604 Mapleton St SE
- 8613 Mapleton St SE
- 8583 Mapleton St SE
- 8572 Mapleton St SE
- 8573 Mapleton St SE
- 8533 Mapleton St SE
- 8720 Mapleton St SE
- 8511 Mapleton St SE
- 8504 Mapleton St SE
- 8745 Mapleton St SE
- 3855 Ravenna Ave SE
- 8481 Mapleton St SE
- 8771 Mapleton St SE
- 8472 Mapleton St SE
- 8471 Mapleton St SE
- 8471 8441 Mapleton St SE
- 8452 Mapleton St SE
- 8441 Mapleton St SE
- 8810 Mapleton St SE
- 8831 Mapleton St SE
Your Personal Tour Guide
Ask me questions while you tour the home.