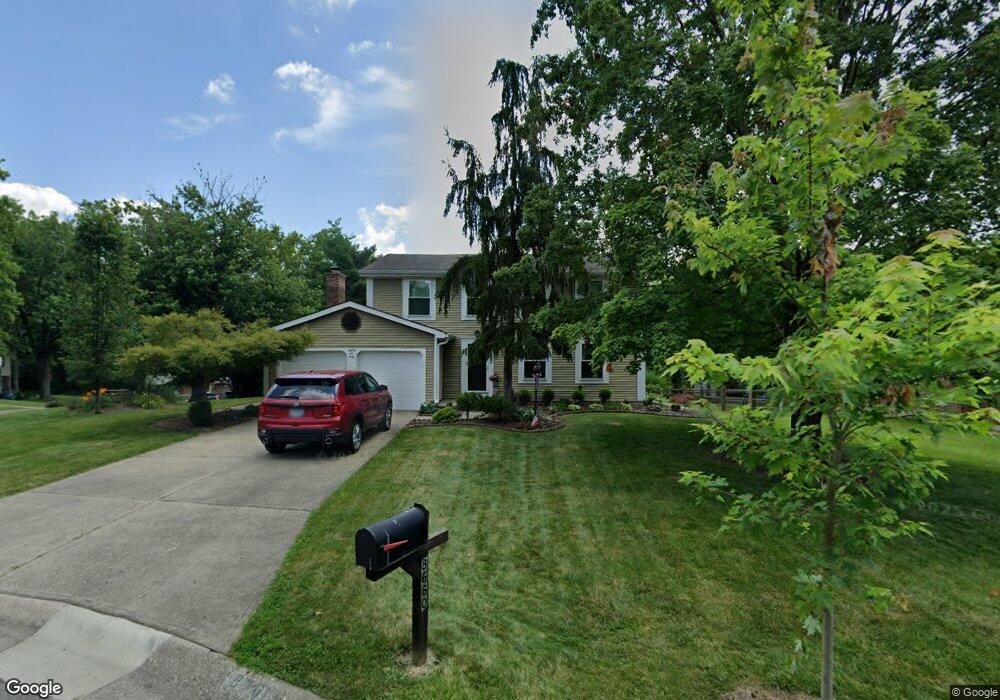
8660 Simpson Ct Mason, OH 45040
Landen NeighborhoodEstimated Value: $374,000 - $394,000
4
Beds
3
Baths
2,092
Sq Ft
$182/Sq Ft
Est. Value
About This Home
This home is located at 8660 Simpson Ct, Mason, OH 45040 and is currently estimated at $381,779, approximately $182 per square foot. 8660 Simpson Ct is a home located in Warren County with nearby schools including Kings Junior High School, Kings High School, and King Of Kings Lutheran Early Childhood Education.
Ownership History
Date
Name
Owned For
Owner Type
Purchase Details
Closed on
Nov 18, 2025
Sold by
Lovaglio Dominic R and Lovaglio Patricia L
Bought by
Lovaglio Preservation Trust and Schaefer
Current Estimated Value
Purchase Details
Closed on
Mar 4, 1992
Sold by
Crawford Crawford and Crawford Rubert
Bought by
Lo Vaglio and Lo Dominic R
Purchase Details
Closed on
Sep 16, 1991
Sold by
Uhlfelder Donna J and Uhlfelder Donna J
Bought by
Crawford and Crawford Rubert
Purchase Details
Closed on
Mar 4, 1988
Sold by
Uhlfelder David A and Uhlfelder Don
Bought by
Uhlfelder and Uhlfelder Donna J
Purchase Details
Closed on
Aug 21, 1978
Sold by
Crest Communities Inc
Purchase Details
Closed on
May 22, 1978
Sold by
Landen Farm Company
Purchase Details
Closed on
Jan 19, 1978
Sold by
Landen Farm Co
Create a Home Valuation Report for This Property
The Home Valuation Report is an in-depth analysis detailing your home's value as well as a comparison with similar homes in the area
Home Values in the Area
Average Home Value in this Area
Purchase History
We collect this data history from publicly available records. To have your information removed, we recommend requesting removal directly through your county’s website.
| Date | Buyer | Sale Price | Title Company |
|---|---|---|---|
| Lovaglio Preservation Trust | -- | None Listed On Document | |
| Lo Vaglio | $107,000 | -- | |
| Crawford | $84,000 | -- | |
| Uhlfelder | -- | -- | |
| -- | $64,200 | -- | |
| -- | $50,800 | -- | |
| -- | -- | -- |
Source: Public Records
Tax History
| Year | Tax Paid | Tax Assessment Tax Assessment Total Assessment is a certain percentage of the fair market value that is determined by local assessors to be the total taxable value of land and additions on the property. | Land | Improvement |
|---|---|---|---|---|
| 2025 | $5,209 | $99,860 | $24,500 | $75,360 |
| 2024 | $5,209 | $99,860 | $24,500 | $75,360 |
| 2023 | $4,628 | $79,695 | $12,915 | $66,780 |
| 2022 | $4,543 | $79,695 | $12,915 | $66,780 |
| 2021 | $3,806 | $79,695 | $12,915 | $66,780 |
| 2020 | $3,679 | $64,792 | $10,500 | $54,292 |
| 2019 | $3,723 | $64,792 | $10,500 | $54,292 |
| 2018 | $3,703 | $64,792 | $10,500 | $54,292 |
| 2017 | $3,874 | $60,011 | $10,371 | $49,641 |
| 2016 | $3,973 | $60,011 | $10,371 | $49,641 |
| 2015 | $3,377 | $60,011 | $10,371 | $49,641 |
| 2014 | $3,377 | $53,110 | $9,180 | $43,930 |
| 2013 | $3,382 | $60,760 | $10,500 | $50,260 |
Source: Public Records
Map
Nearby Homes
- 8839 Pollard Place
- 3516 Cutter Ln
- 3237 S Cove Ct
- 8188 Columbia Rd
- 3444 Cutter Ln
- 3222 Locust Ave
- 9491 Carriage Run Cir
- 9282 Greenery Ct Unit 311E
- 9434 Greenery Ct
- 9388 Hickory Hill Ct
- 9594 Greenery Ct
- 8833 Dover Dr
- 7824 Golden Meadow Dr
- 9642 Old Village Dr
- 2898 Mossy Brink Ct Unit 19
- 4395 S Mallard Cove
- 7790 Strawberry Hill Ln
- 7754 Cove View Dr
- 3556 Twenty Mile Way Unit 3556
- 2859 Mossy Brink Ct
- 8684 Simpson Ct
- 8664 Simpson Ct
- 8658 Simpson Ct
- 8688 Simpson Ct
- 8666 Simpson Ct
- 8654 Simpson Ct
- 8686 Simpson Ct
- 8662 Simpson Ct
- 8661 Simpson Ct
- 8675 Simpson Ct
- 8659 Simpson Ct
- 8698 Simpson Ct
- 8693 Simpson Ct
- 3795 Irwin Simpson Rd
- 3807 Irwin Simpson Rd
- 8663 Simpson Ct
- 8696 Simpson Ct
- 3819 Irwin Simpson Rd
- 3783 Irwin Simpson Rd
- 8711 Simpson Ct
Your Personal Tour Guide
Ask me questions while you tour the home.