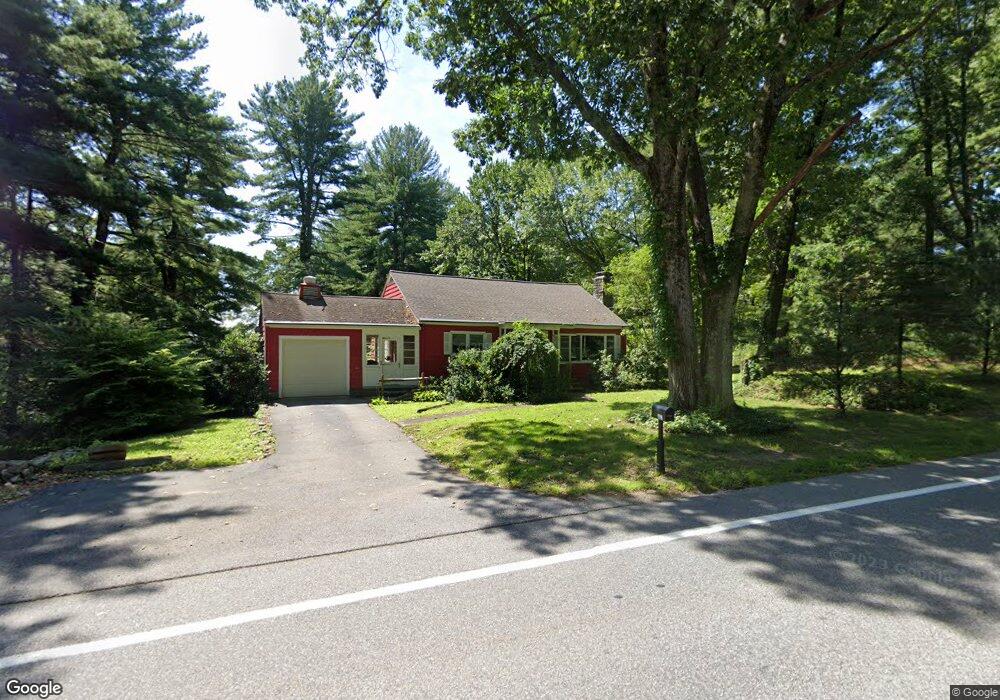
867 Sutton St Northbridge, MA 01534
Northbridge AreaEstimated Value: $410,000 - $455,000
3
Beds
1
Bath
1,080
Sq Ft
$394/Sq Ft
Est. Value
About This Home
This home is located at 867 Sutton St, Northbridge, MA 01534 and is currently estimated at $425,780, approximately $394 per square foot. 867 Sutton St is a home located in Worcester County with nearby schools including Northbridge Elementary School, Northbridge Middle School, and Northbridge High School.
Create a Home Valuation Report for This Property
The Home Valuation Report is an in-depth analysis detailing your home's value as well as a comparison with similar homes in the area
Home Values in the Area
Average Home Value in this Area
Tax History
We collect this data history from publicly available records. To have your information removed, we recommend requesting removal directly through your county’s website.
| Year | Tax Paid | Tax Assessment Tax Assessment Total Assessment is a certain percentage of the fair market value that is determined by local assessors to be the total taxable value of land and additions on the property. | Land | Improvement |
|---|---|---|---|---|
| 2025 | $4,114 | $348,900 | $165,500 | $183,400 |
| 2024 | $4,033 | $333,600 | $165,500 | $168,100 |
| 2023 | $4,266 | $329,200 | $165,500 | $163,700 |
| 2022 | $3,839 | $278,800 | $129,500 | $149,300 |
| 2021 | $3,694 | $254,900 | $123,400 | $131,500 |
| 2020 | $0 | $249,300 | $123,400 | $125,900 |
| 2019 | $3,132 | $241,500 | $123,400 | $118,100 |
| 2018 | $2,980 | $230,300 | $117,800 | $112,500 |
| 2017 | $3,004 | $222,000 | $117,800 | $104,200 |
| 2016 | $2,830 | $205,800 | $107,400 | $98,400 |
| 2015 | $2,653 | $198,300 | $107,400 | $90,900 |
| 2014 | $2,629 | $198,300 | $107,400 | $90,900 |
Source: Public Records
Map
Nearby Homes
- 110 Chipper Hill Rd
- 320 Lincoln Cir
- 37 Aspen Ave
- 1076 Hill St
- 111 Lea Ave
- 399 Providence Rd Unit A
- 5 Peach Tree Dr
- 18 Craftsman Ct Unit 16
- 18 Boundary Stone Rd
- 172 Sutton St
- 4 Brookmeadow Ln
- 319 Providence Rd Unit 319B
- 123 Ferry St Unit 23
- 229 & 225 Providence Rd
- 10 Strawberry Knoll Dr
- 22 Demers St Unit 2
- 26 Summerfield Dr Unit 17
- 11 Sampson St
- 69 Highland View Dr
- 277 Providence Rd Unit A
Your Personal Tour Guide
Ask me questions while you tour the home.