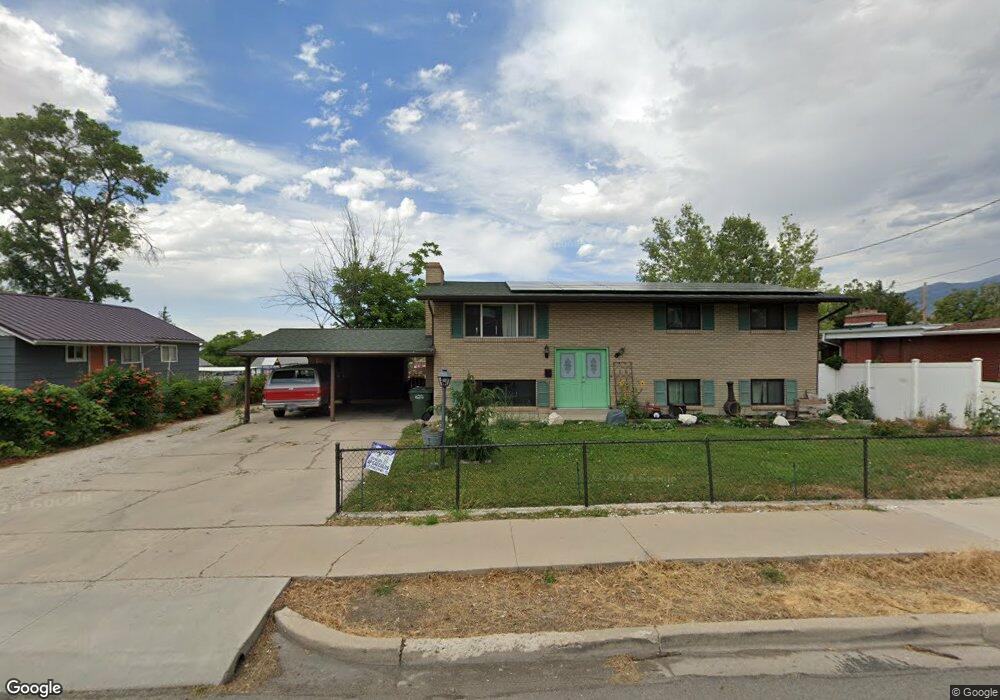
87 E 400 N Tooele, UT 84074
Estimated Value: $390,000 - $428,000
5
Beds
3
Baths
2,350
Sq Ft
$173/Sq Ft
Est. Value
About This Home
This home is located at 87 E 400 N, Tooele, UT 84074 and is currently estimated at $407,685, approximately $173 per square foot. 87 E 400 N is a home located in Tooele County with nearby schools including Sterling Elementary School, Tooele Junior High School, and Tooele High School.
Ownership History
Date
Name
Owned For
Owner Type
Purchase Details
Closed on
Oct 21, 2016
Sold by
Fox Shante Lynn
Bought by
Fox Shante L and Fox David R
Current Estimated Value
Home Financials for this Owner
Home Financials are based on the most recent Mortgage that was taken out on this home.
Original Mortgage
$168,260
Outstanding Balance
$136,618
Interest Rate
3.87%
Mortgage Type
FHA
Estimated Equity
$271,067
Purchase Details
Closed on
Sep 19, 2014
Sold by
Laird Jack M and Laird Susie
Bought by
Fox Shante Lynn
Home Financials for this Owner
Home Financials are based on the most recent Mortgage that was taken out on this home.
Original Mortgage
$171,830
Interest Rate
4.4%
Mortgage Type
FHA
Create a Home Valuation Report for This Property
The Home Valuation Report is an in-depth analysis detailing your home's value as well as a comparison with similar homes in the area
Purchase History
| Date | Buyer | Sale Price | Title Company |
|---|---|---|---|
| Fox Shante L | -- | Highland Title | |
| Fox Shante Lynn | -- | Equity Title |
Source: Public Records
Mortgage History
| Date | Status | Borrower | Loan Amount |
|---|---|---|---|
| Open | Fox Shante L | $168,260 | |
| Closed | Fox Shante Lynn | $171,830 |
Source: Public Records
Tax History
| Year | Tax Paid | Tax Assessment Tax Assessment Total Assessment is a certain percentage of the fair market value that is determined by local assessors to be the total taxable value of land and additions on the property. | Land | Improvement |
|---|---|---|---|---|
| 2025 | $2,850 | $432,260 | $132,500 | $299,760 |
| 2024 | $3,286 | $250,830 | $72,875 | $177,955 |
| 2023 | $3,286 | $275,607 | $69,933 | $205,674 |
| 2022 | $2,737 | $235,468 | $66,000 | $169,468 |
| 2021 | $2,294 | $165,048 | $44,000 | $121,048 |
| 2020 | $2,219 | $276,963 | $56,875 | $220,088 |
| 2019 | $2,064 | $253,382 | $56,875 | $196,507 |
| 2018 | $1,897 | $220,876 | $50,000 | $170,876 |
| 2017 | $1,570 | $216,859 | $41,625 | $175,234 |
| 2016 | $1,303 | $106,701 | $22,894 | $83,807 |
| 2015 | $1,303 | $94,783 | $0 | $0 |
| 2014 | -- | $94,783 | $0 | $0 |
Source: Public Records
Map
Nearby Homes
Your Personal Tour Guide
Ask me questions while you tour the home.