87 Elm St Montclair, NJ 07042
Estimated Value: $808,883 - $1,004,000
About This Home
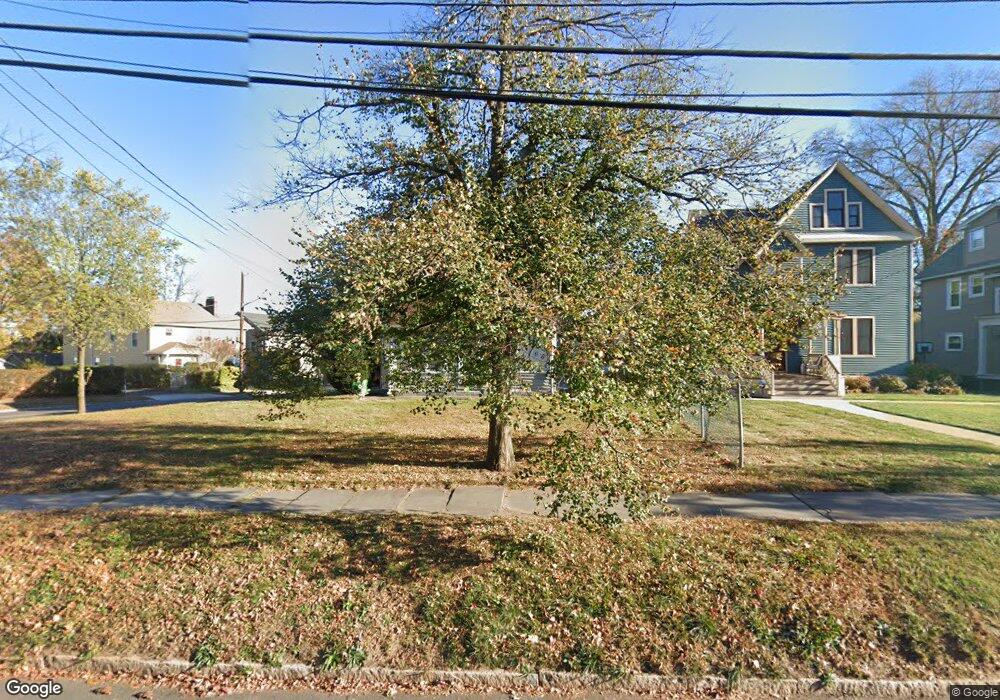
This home is located at 87 Elm St, Montclair, NJ 07042 and is currently estimated at $901,221, approximately $358 per square foot. 87 Elm St is a home located in Essex County with nearby schools including Nishuane School, Hillside School, and Bradford School.
Ownership History
We collect this data history from publicly available records. To have your information removed, we recommend requesting removal directly through your county’s website.
Purchase Details
Purchase Details
Home Financials for this Owner
Home Financials are based on the most recent Mortgage that was taken out on this home.Home Values in the Area
Average Home Value in this Area
Purchase History
We collect this data history from publicly available records. To have your information removed, we recommend requesting removal directly through your county’s website.
| Date | Buyer | Sale Price | Title Company |
|---|---|---|---|
| -- | None Available | ||
| $165,000 | -- |
Mortgage History
We collect this data history from publicly available records. To have your information removed, we recommend requesting removal directly through your county’s website.
| Date | Status | Borrower | Loan Amount |
|---|---|---|---|
| Open | $132,000 |
Tax History
We collect this data history from publicly available records. To have your information removed, we recommend requesting removal directly through your county’s website.
| Year | Tax Paid | Tax Assessment Tax Assessment Total Assessment is a certain percentage of the fair market value that is determined by local assessors to be the total taxable value of land and additions on the property. | Land | Improvement |
|---|---|---|---|---|
| 2025 | $13,241 | $389,100 | $127,100 | $262,000 |
| 2024 | $13,152 | $389,100 | $127,100 | $262,000 |
| 2022 | $12,794 | $389,100 | $127,100 | $262,000 |
| 2021 | $12,572 | $389,100 | $127,100 | $262,000 |
| 2020 | $12,369 | $389,100 | $127,100 | $262,000 |
| 2019 | $12,241 | $389,100 | $127,100 | $262,000 |
| 2018 | $12,039 | $389,100 | $127,100 | $262,000 |
| 2017 | $10,250 | $274,500 | $88,400 | $186,100 |
| 2016 | $9,975 | $274,500 | $88,400 | $186,100 |
| 2015 | $9,679 | $274,500 | $88,400 | $186,100 |
| 2014 | $9,355 | $274,500 | $88,400 | $186,100 |
Map
- 90 Gates Ave
- 118 S Fullerton Ave
- 30 1/2 Irving St
- 28 Irving St
- 166 Lincoln St
- 101 Gates Ave Unit 2A
- 101 Gates Ave Unit 1
- 104 Gates Ave
- 156 Lincoln St
- 7 Prospect Terrace
- 14 Wheeler St
- 41 Mission St
- 42 Llewellyn Rd
- 66 S Fullerton Ave Unit 8
- 65-67 Union St Unit 3004
- 20 Monroe Place
- 57 Union St Unit C4021
- 57 Union St Unit 21
- 220 Bloomfield Ave
- 36 S Willow St
Ask me questions while you tour the home.