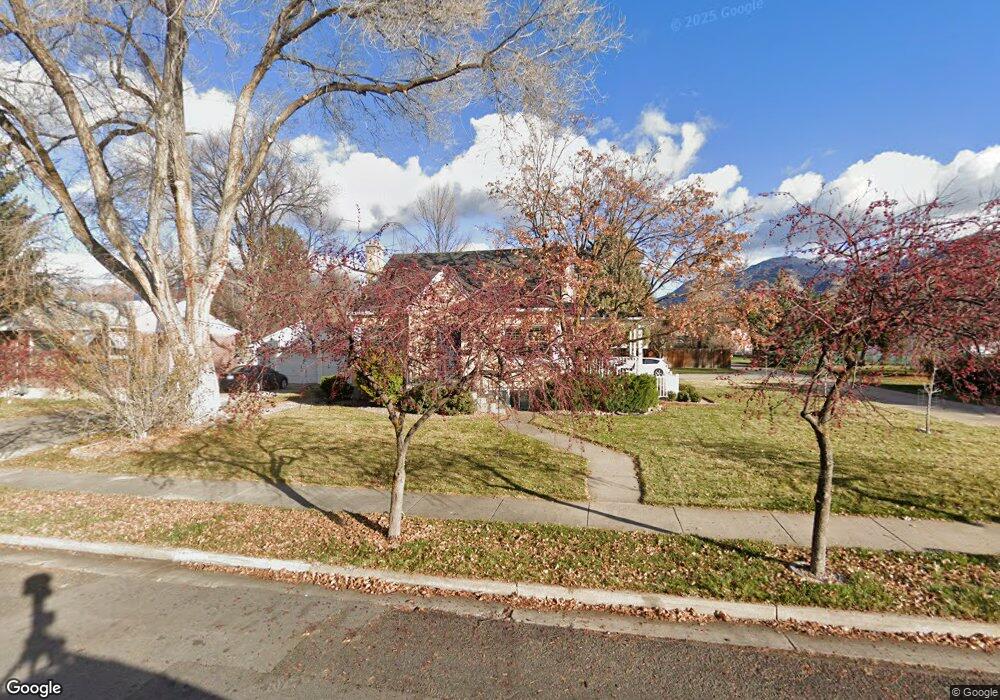
872 N 300 E Logan, UT 84321
Adams NeighborhoodEstimated Value: $405,000 - $464,000
4
Beds
2
Baths
2,606
Sq Ft
$165/Sq Ft
Est. Value
About This Home
This home is located at 872 N 300 E, Logan, UT 84321 and is currently estimated at $429,473, approximately $164 per square foot. 872 N 300 E is a home located in Cache County with nearby schools including Adams Elementary School, Mount Logan Middle School, and Logan High School.
Ownership History
Date
Name
Owned For
Owner Type
Purchase Details
Closed on
Mar 17, 2021
Sold by
Paulsin Michael and Paulsin Susan
Bought by
Redboy Properties Llc
Current Estimated Value
Home Financials for this Owner
Home Financials are based on the most recent Mortgage that was taken out on this home.
Original Mortgage
$150,000
Outstanding Balance
$134,159
Interest Rate
2.7%
Mortgage Type
New Conventional
Estimated Equity
$295,314
Purchase Details
Closed on
Feb 25, 2020
Sold by
Paulsin Michael and Paulsin Susan
Bought by
Redboy Properties Llc
Home Financials for this Owner
Home Financials are based on the most recent Mortgage that was taken out on this home.
Original Mortgage
$149,000
Interest Rate
3.6%
Mortgage Type
New Conventional
Purchase Details
Closed on
Feb 2, 2018
Sold by
Paulsin Michael P and Paulsin Susan E
Bought by
Redboy Properties Llc
Purchase Details
Closed on
Dec 27, 2016
Sold by
Webb David L and Webb Lacy K
Bought by
Paulsin Michael P and Paulsin Susan E
Home Financials for this Owner
Home Financials are based on the most recent Mortgage that was taken out on this home.
Original Mortgage
$154,000
Interest Rate
4.08%
Mortgage Type
New Conventional
Purchase Details
Closed on
Dec 2, 2016
Sold by
Black Duane K and Black Leisa J
Bought by
Webb David L and Webb Lacy K
Home Financials for this Owner
Home Financials are based on the most recent Mortgage that was taken out on this home.
Original Mortgage
$154,000
Interest Rate
4.08%
Mortgage Type
New Conventional
Purchase Details
Closed on
Jun 29, 2005
Sold by
Webb Lacy K
Bought by
Webb David L and Webb Lacy K
Home Financials for this Owner
Home Financials are based on the most recent Mortgage that was taken out on this home.
Original Mortgage
$32,200
Interest Rate
5.65%
Mortgage Type
Stand Alone Second
Purchase Details
Closed on
Jun 28, 2005
Sold by
Starley Nate
Bought by
Webb Lacy K
Home Financials for this Owner
Home Financials are based on the most recent Mortgage that was taken out on this home.
Original Mortgage
$32,200
Interest Rate
5.65%
Mortgage Type
Stand Alone Second
Create a Home Valuation Report for This Property
The Home Valuation Report is an in-depth analysis detailing your home's value as well as a comparison with similar homes in the area
Home Values in the Area
Average Home Value in this Area
Purchase History
| Date | Buyer | Sale Price | Title Company |
|---|---|---|---|
| Redboy Properties Llc | -- | Pinnacle Title | |
| Paulsin Michael | -- | Pinnacle Title | |
| Redboy Properties Llc | -- | Pinnacle Title | |
| Paulsin Michael | -- | Pinnacle Title | |
| Redboy Properties Llc | -- | -- | |
| Paulsin Michael P | -- | Cache Title Company | |
| Webb David L | -- | Cache Title Company | |
| Webb David L | -- | Cache Title Company | |
| Webb Lacy K | -- | Cache Title Company |
Source: Public Records
Mortgage History
| Date | Status | Borrower | Loan Amount |
|---|---|---|---|
| Open | Paulsin Michael | $150,000 | |
| Previous Owner | Paulsin Michael | $149,000 | |
| Previous Owner | Paulsin Michael P | $154,000 | |
| Previous Owner | Webb Lacy K | $32,200 |
Source: Public Records
Tax History
| Year | Tax Paid | Tax Assessment Tax Assessment Total Assessment is a certain percentage of the fair market value that is determined by local assessors to be the total taxable value of land and additions on the property. | Land | Improvement |
|---|---|---|---|---|
| 2025 | $1,929 | $249,485 | $0 | $0 |
| 2023 | $2,072 | $247,440 | $0 | $0 |
| 2022 | $2,156 | $240,420 | $0 | $0 |
| 2021 | $1,668 | $287,320 | $45,000 | $242,320 |
| 2020 | $1,493 | $231,400 | $45,000 | $186,400 |
| 2019 | $1,560 | $231,400 | $45,000 | $186,400 |
| 2018 | $1,551 | $210,088 | $45,000 | $165,088 |
| 2017 | $1,478 | $105,820 | $0 | $0 |
| 2016 | $1,532 | $81,510 | $0 | $0 |
| 2015 | $1,182 | $81,510 | $0 | $0 |
| 2014 | $1,068 | $81,510 | $0 | $0 |
| 2013 | -- | $77,880 | $0 | $0 |
Source: Public Records
Map
Nearby Homes
Your Personal Tour Guide
Ask me questions while you tour the home.