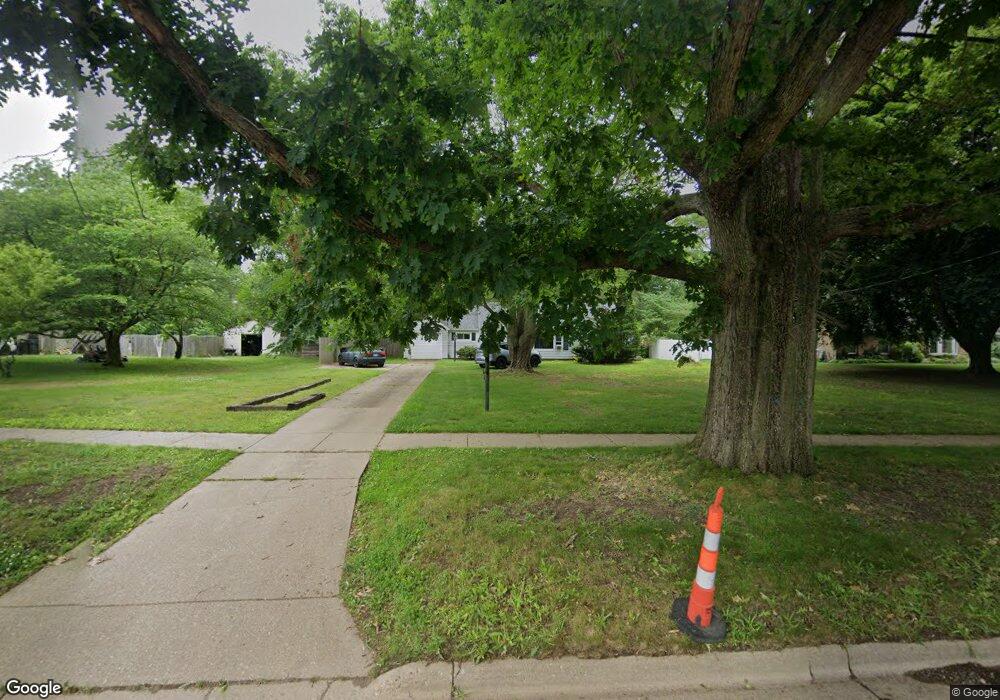
874 Ely St Allegan, MI 49010
Estimated Value: $181,641 - $284,000
3
Beds
2
Baths
1,570
Sq Ft
$145/Sq Ft
Est. Value
About This Home
This home is located at 874 Ely St, Allegan, MI 49010 and is currently estimated at $228,160, approximately $145 per square foot. 874 Ely St is a home located in Allegan County with nearby schools including West Ward Elementary School, L.E. White Middle School, and Allegan High School.
Ownership History
Date
Name
Owned For
Owner Type
Purchase Details
Closed on
Aug 15, 2023
Sold by
Tafil Kameron J
Bought by
Hunter Gage Allen
Current Estimated Value
Home Financials for this Owner
Home Financials are based on the most recent Mortgage that was taken out on this home.
Original Mortgage
$96,000
Outstanding Balance
$94,234
Interest Rate
6.96%
Mortgage Type
New Conventional
Estimated Equity
$133,926
Purchase Details
Closed on
May 21, 2010
Sold by
Laninga Mary Jane and Darby Helen
Bought by
Tafil Kameron J
Home Financials for this Owner
Home Financials are based on the most recent Mortgage that was taken out on this home.
Original Mortgage
$95,000
Interest Rate
5.12%
Mortgage Type
New Conventional
Purchase Details
Closed on
Sep 20, 2002
Sold by
Adams Peggy J
Bought by
Laninga Mary Jane
Purchase Details
Closed on
Jul 29, 1999
Bought by
Adams Peggy
Purchase Details
Closed on
Oct 21, 1991
Sold by
Bollinger Kenneth and Bollinger Melva
Bought by
Bollinger Trust No 1
Create a Home Valuation Report for This Property
The Home Valuation Report is an in-depth analysis detailing your home's value as well as a comparison with similar homes in the area
Home Values in the Area
Average Home Value in this Area
Purchase History
We collect this data history from publicly available records. To have your information removed, we recommend requesting removal directly through your county’s website.
| Date | Buyer | Sale Price | Title Company |
|---|---|---|---|
| Hunter Gage Allen | $120,000 | Chicago Title | |
| Tafil Kameron J | $95,000 | -- | |
| Laninga Mary Jane | -- | Chicago Title | |
| Adams Peggy | $88,500 | -- | |
| Bollinger Trust No 1 | -- | -- |
Source: Public Records
Mortgage History
We collect this data history from publicly available records. To have your information removed, we recommend requesting removal directly through your county’s website.
| Date | Status | Borrower | Loan Amount |
|---|---|---|---|
| Open | Hunter Gage Allen | $96,000 | |
| Previous Owner | Tafil Kameron J | $95,000 |
Source: Public Records
Tax History
| Year | Tax Paid | Tax Assessment Tax Assessment Total Assessment is a certain percentage of the fair market value that is determined by local assessors to be the total taxable value of land and additions on the property. | Land | Improvement |
|---|---|---|---|---|
| 2025 | $4,662 | $107,500 | $34,400 | $73,100 |
| 2024 | $1,937 | $103,900 | $33,000 | $70,900 |
| 2023 | $2,418 | $90,300 | $31,000 | $59,300 |
| 2022 | $1,937 | $76,300 | $26,100 | $50,200 |
| 2021 | $1,852 | $69,200 | $20,600 | $48,600 |
| 2020 | $1,825 | $61,500 | $17,200 | $44,300 |
| 2019 | $1,780 | $54,800 | $15,500 | $39,300 |
| 2018 | $1,875 | $50,000 | $15,200 | $34,800 |
| 2017 | $0 | $45,700 | $12,700 | $33,000 |
| 2016 | $0 | $38,100 | $10,600 | $27,500 |
| 2015 | -- | $38,100 | $10,600 | $27,500 |
| 2014 | -- | $38,800 | $9,900 | $28,900 |
| 2013 | $2,368 | $40,200 | $9,900 | $30,300 |
Source: Public Records
Map
Nearby Homes
Your Personal Tour Guide
Ask me questions while you tour the home.