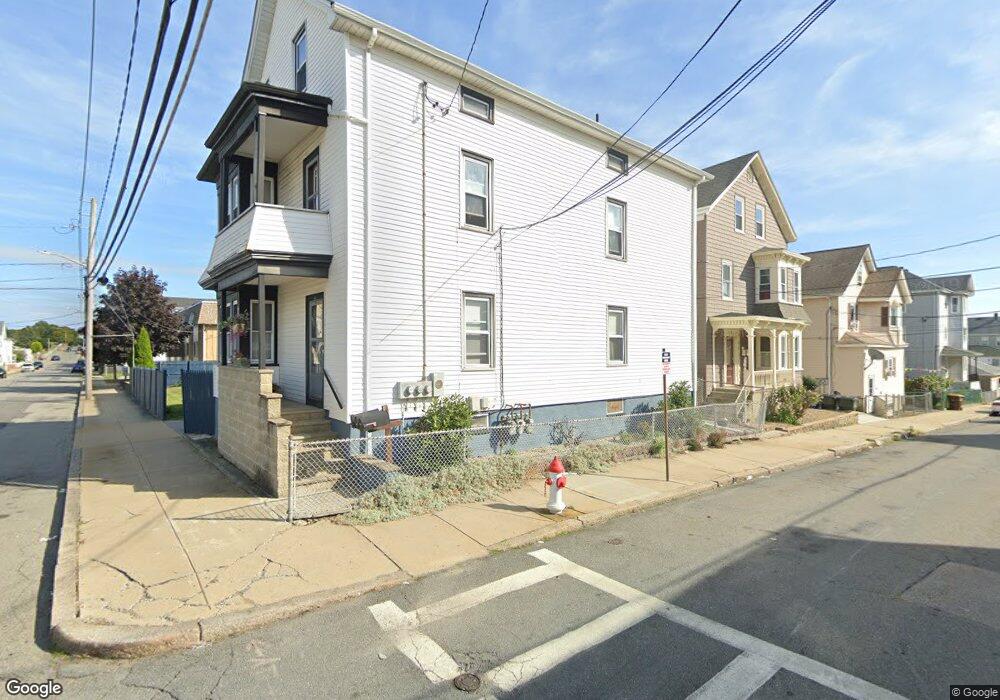
875 Locust St Fall River, MA 02720
Oak Grove Village NeighborhoodEstimated Value: $546,000 - $647,000
About This Home
This home is located at 875 Locust St, Fall River, MA 02720 and is currently estimated at $605,667, approximately $224 per square foot. 875 Locust St is a home located in Bristol County with nearby schools including Mary Fonseca Elementary School, Morton Middle School, and B M C Durfee High School.
Ownership History
We collect this data history from publicly available records. To have your information removed, we recommend requesting removal directly through your county’s website.
Purchase Details
Purchase Details
Home Financials for this Owner
Home Financials are based on the most recent Mortgage that was taken out on this home.Home Values in the Area
Average Home Value in this Area
Purchase History
We collect this data history from publicly available records. To have your information removed, we recommend requesting removal directly through your county’s website.
| Date | Buyer | Sale Price | Title Company |
|---|---|---|---|
| -- | -- | ||
| $102,500 | -- |
Mortgage History
We collect this data history from publicly available records. To have your information removed, we recommend requesting removal directly through your county’s website.
| Date | Status | Borrower | Loan Amount |
|---|---|---|---|
| Previous Owner | $143,100 |
Tax History
We collect this data history from publicly available records. To have your information removed, we recommend requesting removal directly through your county’s website.
| Year | Tax Paid | Tax Assessment Tax Assessment Total Assessment is a certain percentage of the fair market value that is determined by local assessors to be the total taxable value of land and additions on the property. | Land | Improvement |
|---|---|---|---|---|
| 2025 | $5,185 | $452,800 | $125,600 | $327,200 |
| 2024 | $4,965 | $432,100 | $120,900 | $311,200 |
| 2023 | $4,428 | $360,900 | $103,600 | $257,300 |
| 2022 | $3,915 | $310,200 | $94,200 | $216,000 |
| 2021 | $3,700 | $267,500 | $87,200 | $180,300 |
| 2020 | $3,332 | $230,600 | $83,400 | $147,200 |
| 2019 | $2,865 | $196,500 | $79,500 | $117,000 |
| 2018 | $2,482 | $169,800 | $78,000 | $91,800 |
| 2017 | $2,400 | $171,400 | $79,600 | $91,800 |
| 2016 | $2,350 | $172,400 | $82,900 | $89,500 |
| 2015 | $2,214 | $169,300 | $79,800 | $89,500 |
| 2014 | $2,290 | $182,000 | $84,000 | $98,000 |
Map
- 243 Robeson St Unit 6
- 243 Robeson St Unit 3
- 119-121 Tremont St
- 90 Tremont St
- 37 Shawmut St
- 609 Cherry St
- 511 Bank St
- 540 Cherry St Unit 1
- 630 Maple St
- 434 Linden St Unit 2
- 51 Summerfield St
- 47 Summerfield St
- 120 15th St Unit 4
- 89 Oak St
- 104 Oak St
- 333 Cherry St
- 485 Rock St
- 45 Read St
- 65-67 Farnham St
- 1124 Bedford St
- 287 Tremont St
- 303 Tremont St Unit 305
- 886 Cherry St
- 886 Cherry St Unit 1
- 886 Cherry St Unit 2
- 886 Cherry St Unit 3
- 282 Orange St
- 282 Orange St Unit 2
- 282 Orange St Unit 1
- 292 Orange St
- 288 Tremont St
- 896 Cherry St
- 896 Cherry St Unit 1
- 315 Tremont St
- 879 Cherry St
- 274 Tremont St
- 302 Tremont St Unit 1E
- 302 Tremont St Unit 3E
- 302 Tremont St Unit 2E
- 302 Tremont St Unit 3W
Ask me questions while you tour the home.