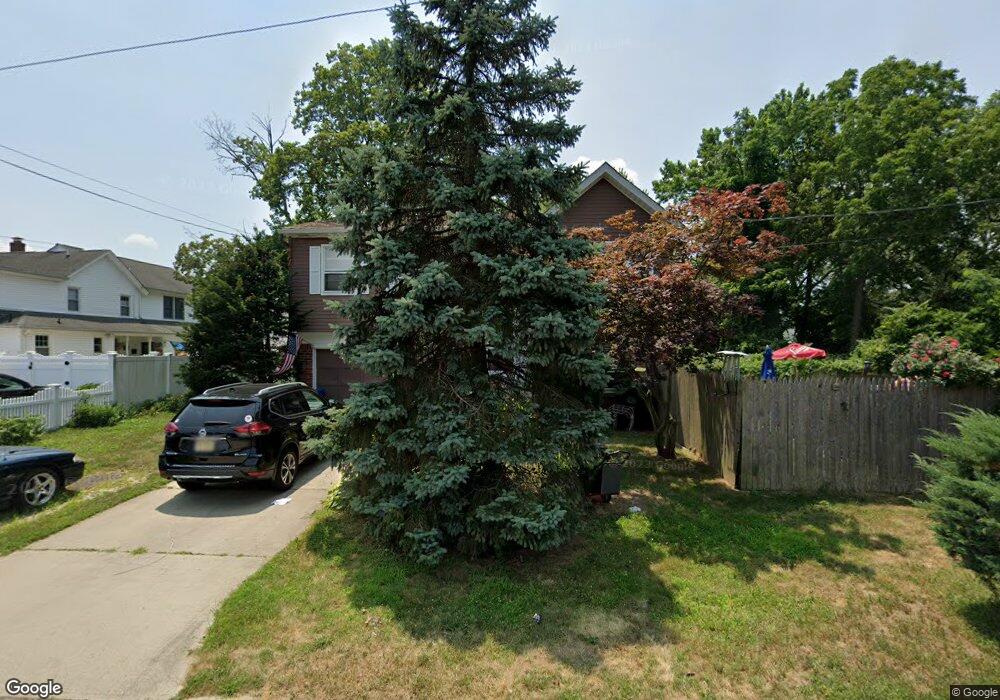
88 Walling Ave Belford, NJ 07718
New Monmouth NeighborhoodEstimated Value: $578,000 - $669,495
About This Home
This home is located at 88 Walling Ave, Belford, NJ 07718 and is currently estimated at $616,374, approximately $419 per square foot. 88 Walling Ave is a home located in Monmouth County with nearby schools including New Monmouth Elementary School, Thorne Middle School, and Middletown High School North.
Ownership History
We collect this data history from publicly available records. To have your information removed, we recommend requesting removal directly through your county’s website.
Purchase Details
Home Values in the Area
Average Home Value in this Area
Purchase History
We collect this data history from publicly available records. To have your information removed, we recommend requesting removal directly through your county’s website.
| Date | Buyer | Sale Price | Title Company |
|---|---|---|---|
| $137,500 | -- |
Tax History
We collect this data history from publicly available records. To have your information removed, we recommend requesting removal directly through your county’s website.
| Year | Tax Paid | Tax Assessment Tax Assessment Total Assessment is a certain percentage of the fair market value that is determined by local assessors to be the total taxable value of land and additions on the property. | Land | Improvement |
|---|---|---|---|---|
| 2026 | $9,797 | $653,700 | $427,700 | $226,000 |
| 2025 | $9,797 | $607,000 | $380,100 | $226,900 |
| 2024 | $8,007 | $515,200 | $292,400 | $222,800 |
| 2023 | $8,007 | $460,700 | $240,200 | $220,500 |
| 2022 | $7,985 | $422,700 | $211,200 | $211,500 |
| 2021 | $7,985 | $383,900 | $200,200 | $183,700 |
| 2020 | $7,943 | $371,500 | $192,000 | $179,500 |
| 2019 | $7,502 | $355,200 | $184,700 | $170,500 |
| 2018 | $7,786 | $359,300 | $180,400 | $178,900 |
| 2017 | $7,843 | $358,300 | $180,400 | $177,900 |
| 2016 | $6,866 | $322,200 | $170,400 | $151,800 |
| 2015 | $7,082 | $320,900 | $170,400 | $150,500 |
| 2014 | $7,221 | $319,100 | $170,400 | $148,700 |
Map
- 76 Morris Ave
- 147 Clairmont Ave
- 407 Church St
- 248 Church St
- 11 W Park Ave
- 310 East Rd
- 0 W Morris Ave Unit 22602220
- 210 Church St
- 55 Drift Rd
- 402 Wedgewood Cir
- 414 Wedgewood Cir Unit 25
- 574 Hopping Rd
- 138 Church St
- 71 Compton St
- 564 Morley Ct
- 294 Leonardville Rd
- 0 Prospect Rd Unit 22619630
- 662 Campbell Ave
- 38 Collins Ave
- 469 East Rd
Ask me questions while you tour the home.