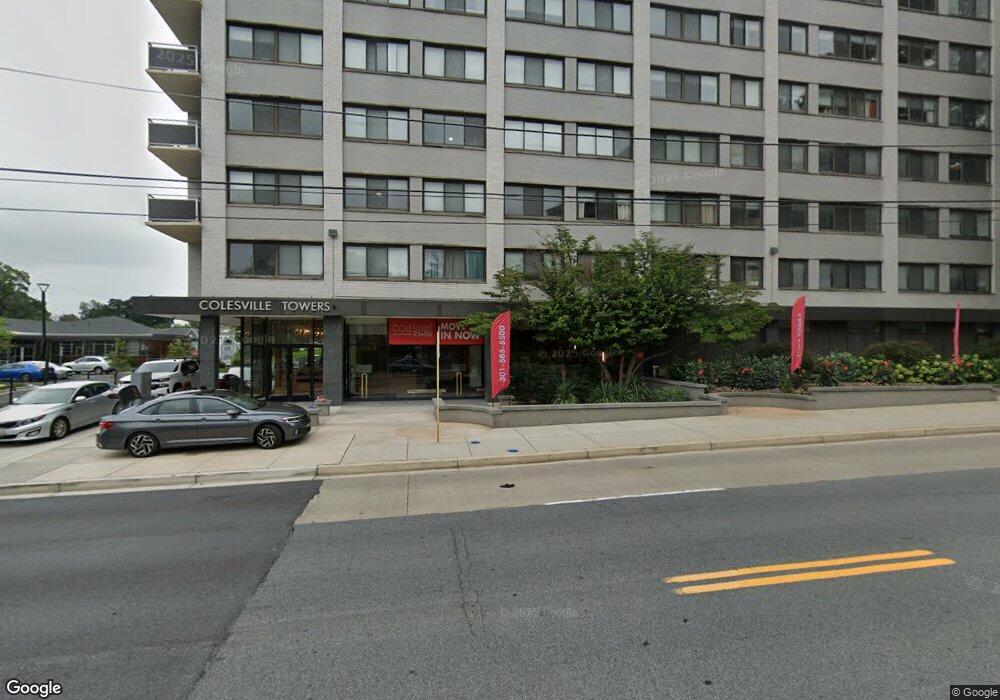
8811 Colesville Rd Silver Spring, MD 20910
Silver Spring Park Neighborhood
3
Beds
--
Bath
1,340
Sq Ft
--
Built
About This Home
Enjoy downtown Silver Spring easy living just across the street from the new redevelopment district! Colesville Towers offers magnificent city and park views from your large balcony or patio. Walkability is at its best with a short walk to the Metro, fine dining and theatre & Metro Bus and Ride-on service at your door! Features include: Most utilities included, garage & street parking, large floor plans with spacious closets, bike rooms, outdoor grilling area with pool and sun deck, fitness center, community billiards room, 24-hour attended front desk, controlled access, and more.
Create a Home Valuation Report for This Property
The Home Valuation Report is an in-depth analysis detailing your home's value as well as a comparison with similar homes in the area
Home Values in the Area
Average Home Value in this Area
Property History
| Date | Event | Price | List to Sale | Price per Sq Ft |
|---|---|---|---|---|
| 04/01/2023 04/01/23 | Price Changed | $1,415 | +2.2% | $3 / Sq Ft |
| 03/04/2023 03/04/23 | Price Changed | $1,385 | -0.7% | $2 / Sq Ft |
| 03/02/2023 03/02/23 | Price Changed | $1,395 | -1.4% | $2 / Sq Ft |
| 02/25/2023 02/25/23 | Price Changed | $1,415 | +2.2% | $3 / Sq Ft |
| 02/01/2023 02/01/23 | Price Changed | $1,385 | -2.1% | $2 / Sq Ft |
| 01/28/2023 01/28/23 | Price Changed | $1,415 | +2.2% | $3 / Sq Ft |
| 01/26/2023 01/26/23 | Price Changed | $1,385 | -2.1% | $2 / Sq Ft |
| 01/10/2023 01/10/23 | Price Changed | $1,415 | -4.1% | $3 / Sq Ft |
| 01/06/2023 01/06/23 | Price Changed | $1,475 | +4.2% | $3 / Sq Ft |
| 12/28/2022 12/28/22 | Price Changed | $1,415 | -0.4% | $3 / Sq Ft |
| 12/22/2022 12/22/22 | Price Changed | $1,420 | -3.7% | $3 / Sq Ft |
| 12/18/2022 12/18/22 | Price Changed | $1,475 | +4.2% | $3 / Sq Ft |
| 12/12/2022 12/12/22 | Price Changed | $1,415 | -4.1% | $3 / Sq Ft |
| 11/16/2022 11/16/22 | Price Changed | $1,475 | +3.5% | $3 / Sq Ft |
| 11/12/2022 11/12/22 | Price Changed | $1,425 | +0.7% | $3 / Sq Ft |
| 09/29/2022 09/29/22 | Price Changed | $1,415 | -0.7% | $3 / Sq Ft |
| 09/20/2022 09/20/22 | Price Changed | $1,425 | +0.7% | $3 / Sq Ft |
| 09/16/2022 09/16/22 | Price Changed | $1,415 | -0.7% | $3 / Sq Ft |
| 09/12/2022 09/12/22 | Price Changed | $1,425 | +2.9% | $3 / Sq Ft |
| 09/01/2022 09/01/22 | Price Changed | $1,385 | -2.8% | $2 / Sq Ft |
| 08/17/2022 08/17/22 | Price Changed | $1,425 | -5.0% | $3 / Sq Ft |
| 08/14/2022 08/14/22 | Price Changed | $1,500 | +5.3% | $3 / Sq Ft |
| 07/20/2022 07/20/22 | Price Changed | $1,425 | +1.1% | $3 / Sq Ft |
| 07/08/2022 07/08/22 | Price Changed | $1,410 | +3.3% | $3 / Sq Ft |
| 07/06/2022 07/06/22 | Price Changed | $1,365 | -3.2% | $2 / Sq Ft |
| 06/11/2022 06/11/22 | Price Changed | $1,410 | -4.4% | $3 / Sq Ft |
| 06/07/2022 06/07/22 | Price Changed | $1,475 | 0.0% | $3 / Sq Ft |
| 06/07/2022 06/07/22 | For Rent | $1,475 | -0.3% | -- |
| 06/02/2022 06/02/22 | Price Changed | $1,480 | +0.3% | $3 / Sq Ft |
| 05/20/2022 05/20/22 | Price Changed | $1,475 | +4.6% | $3 / Sq Ft |
| 05/19/2022 05/19/22 | Price Changed | $1,410 | -4.4% | $3 / Sq Ft |
| 05/18/2022 05/18/22 | For Rent | $1,475 | -- | -- |
Tax History
| Year | Tax Paid | Tax Assessment Tax Assessment Total Assessment is a certain percentage of the fair market value that is determined by local assessors to be the total taxable value of land and additions on the property. | Land | Improvement |
|---|---|---|---|---|
| 2025 | $359,952 | $33,908,700 | -- | -- |
| 2024 | $359,952 | $30,018,600 | $2,807,900 | $27,210,700 |
| 2023 | $403,877 | $33,766,033 | $0 | $0 |
| 2022 | $385,100 | $33,573,133 | $0 | $0 |
| 2021 | $412,983 | $31,879,900 | $2,807,900 | $29,072,000 |
| 2020 | $393,711 | $34,399,467 | $0 | $0 |
| 2019 | $374,285 | $32,699,733 | $0 | $0 |
| 2018 | $355,754 | $31,000,000 | $2,674,200 | $28,325,800 |
| 2017 | $354,518 | $30,347,333 | $0 | $0 |
| 2016 | -- | $29,694,667 | $0 | $0 |
| 2015 | $338,926 | $29,042,000 | $0 | $0 |
| 2014 | $338,926 | $27,569,000 | $0 | $0 |
Source: Public Records
Map
Nearby Homes
- 700 Roeder Rd Unit 101
- 700 Roeder Rd Unit 103
- 8613 Cedar St
- 8901 Ellsworth Ct
- 617 Greenbrier Dr
- 709 Woodside Pkwy
- 1202 Burton St
- 930 Wayne Ave Unit 1009
- 930 Wayne Ave Unit 1302
- 930 Wayne Ave Unit 405
- 708 Hankin St
- 900 Bonifant St Unit C
- 1320 Fenwick Ln Unit 711
- 1320 Fenwick Ln Unit 700
- 1320 Fenwick Ln Unit 203
- 1320 Fenwick Ln Unit 606
- 406 Dale Dr
- 402 Dale Dr
- 1227 Fidler Ln
- 8509 2nd Ave
- 8807 Colesville Rd
- 919 Spring St
- 8901 Colesville Rd
- 8808 Colesville Rd
- 900 Spring St
- 1004 S Noyes Dr
- 700 Roeder Rd
- 700 Roeder Rd Unit 605
- 700 Roeder Rd Unit 206
- 700 Roeder Rd Unit 404
- 700 Roeder Rd Unit 102
- 700 Roeder Rd Unit 505
- 700 Roeder Rd Unit 401
- 700 Roeder Rd Unit 601
- 700 Roeder Rd Unit 304
- 700 Roeder Rd Unit 406
- 700 Roeder Rd Unit 502
- 700 Roeder Rd Unit 501
- 700 Roeder Rd Unit 604
- 700 Roeder Rd Unit 302
Your Personal Tour Guide
Ask me questions while you tour the home.