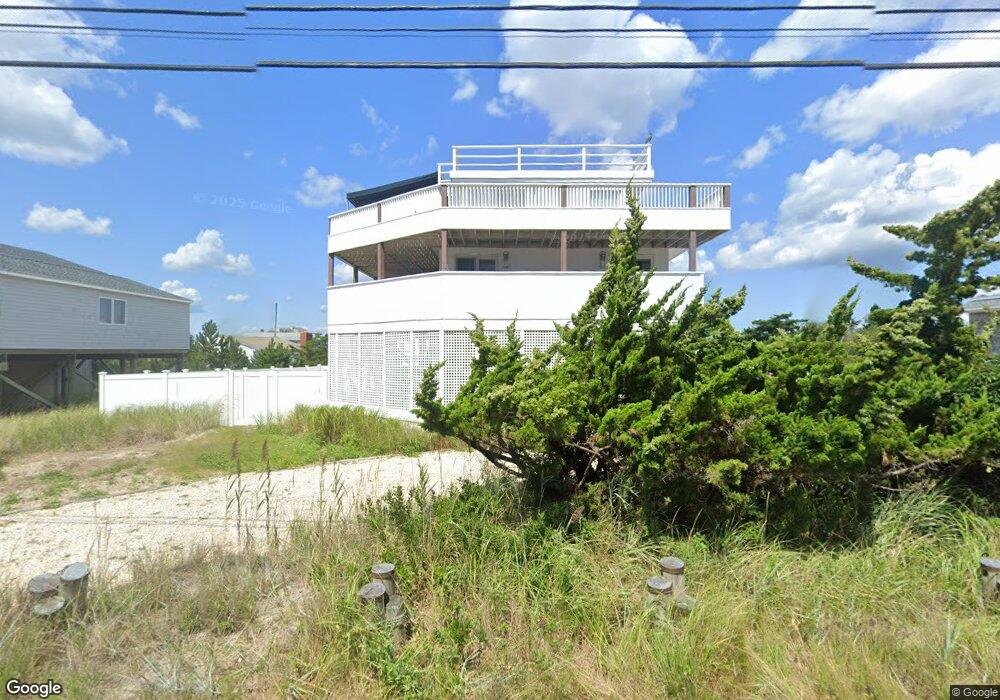
884 Dune Rd Southampton, NY 11968
Estimated Value: $1,711,752 - $3,034,000
2
Beds
1
Bath
928
Sq Ft
$2,696/Sq Ft
Est. Value
About This Home
This home is located at 884 Dune Rd, Southampton, NY 11968 and is currently estimated at $2,501,438, approximately $2,695 per square foot. 884 Dune Rd is a home.
Ownership History
Date
Name
Owned For
Owner Type
Purchase Details
Closed on
May 17, 2011
Sold by
Jacobs Gary
Bought by
Huber Seth P and Kopiasz Tennille
Current Estimated Value
Home Financials for this Owner
Home Financials are based on the most recent Mortgage that was taken out on this home.
Original Mortgage
$928,000
Outstanding Balance
$627,771
Interest Rate
4.85%
Mortgage Type
Purchase Money Mortgage
Estimated Equity
$1,873,667
Purchase Details
Closed on
Aug 30, 2002
Sold by
Jacobs Daniel
Bought by
Jacobs Gary
Purchase Details
Closed on
Jul 3, 1997
Sold by
Witko Ronald and Starosky John
Bought by
Jacobs Daniel
Create a Home Valuation Report for This Property
The Home Valuation Report is an in-depth analysis detailing your home's value as well as a comparison with similar homes in the area
Home Values in the Area
Average Home Value in this Area
Purchase History
We collect this data history from publicly available records. To have your information removed, we recommend requesting removal directly through your county’s website.
| Date | Buyer | Sale Price | Title Company |
|---|---|---|---|
| Huber Seth P | $1,160,000 | -- | |
| Jacobs Gary | -- | Commonwealth Land Title Ins | |
| Jacobs Daniel | $120,000 | -- |
Source: Public Records
Mortgage History
We collect this data history from publicly available records. To have your information removed, we recommend requesting removal directly through your county’s website.
| Date | Status | Borrower | Loan Amount |
|---|---|---|---|
| Open | Huber Seth P | $928,000 |
Source: Public Records
Tax History
| Year | Tax Paid | Tax Assessment Tax Assessment Total Assessment is a certain percentage of the fair market value that is determined by local assessors to be the total taxable value of land and additions on the property. | Land | Improvement |
|---|---|---|---|---|
| 2024 | -- | $1,111,000 | $860,500 | $250,500 |
| 2023 | -- | $1,111,000 | $860,500 | $250,500 |
| 2022 | $10,070 | $1,111,000 | $860,500 | $250,500 |
| 2021 | $10,070 | $1,101,500 | $860,500 | $241,000 |
| 2020 | $6,697 | $1,101,500 | $860,500 | $241,000 |
| 2019 | $6,697 | $0 | $0 | $0 |
| 2018 | -- | $924,700 | $717,100 | $207,600 |
| 2017 | $6,795 | $1,049,100 | $860,500 | $188,600 |
| 2016 | $6,846 | $1,049,100 | $860,500 | $188,600 |
| 2015 | -- | $1,049,100 | $860,500 | $188,600 |
| 2014 | -- | $1,049,100 | $860,500 | $188,600 |
Source: Public Records
Map
Nearby Homes
Your Personal Tour Guide
Ask me questions while you tour the home.