89 Albion St Unit 89A Wakefield, MA 01880
Downtown Wakefield NeighborhoodEstimated Value: $788,358
About This Home
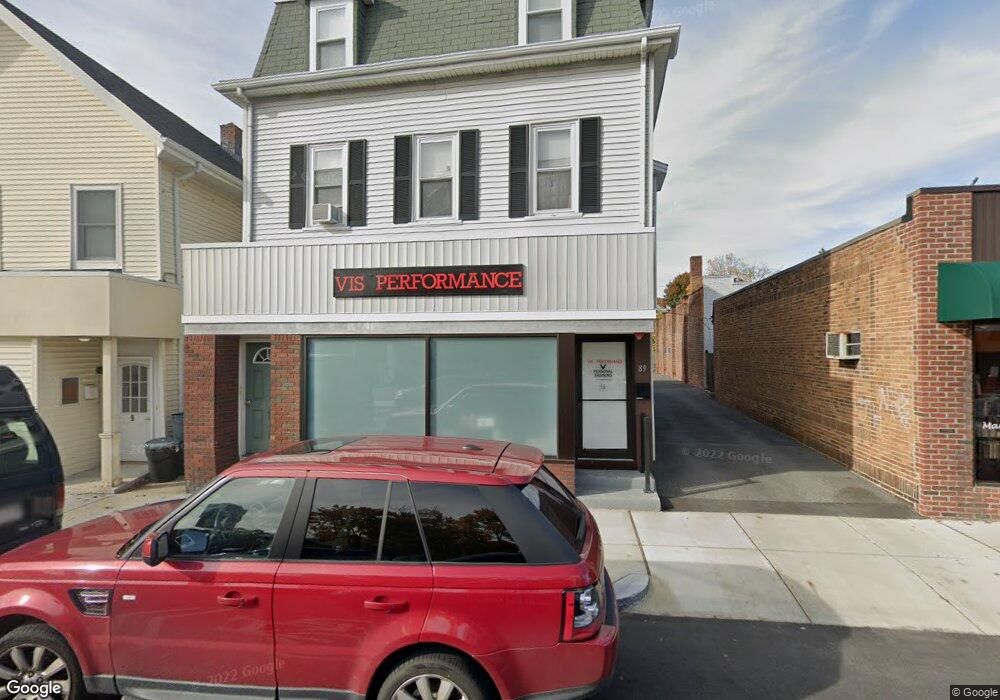
This home is located at 89 Albion St Unit 89A, Wakefield, MA 01880 and is currently estimated at $788,358, approximately $228 per square foot. 89 Albion St Unit 89A is a home located in Middlesex County with nearby schools including Wakefield Memorial High School and Odyssey Day School.
Ownership History
We collect this data history from publicly available records. To have your information removed, we recommend requesting removal directly through your county’s website.
Purchase Details
Home Financials for this Owner
Home Financials are based on the most recent Mortgage that was taken out on this home.Home Values in the Area
Average Home Value in this Area
Purchase History
We collect this data history from publicly available records. To have your information removed, we recommend requesting removal directly through your county’s website.
| Date | Buyer | Sale Price | Title Company |
|---|---|---|---|
| $380,000 | -- |
Mortgage History
We collect this data history from publicly available records. To have your information removed, we recommend requesting removal directly through your county’s website.
| Date | Status | Borrower | Loan Amount |
|---|---|---|---|
| Open | $304,000 |
Tax History
We collect this data history from publicly available records. To have your information removed, we recommend requesting removal directly through your county’s website.
| Year | Tax Paid | Tax Assessment Tax Assessment Total Assessment is a certain percentage of the fair market value that is determined by local assessors to be the total taxable value of land and additions on the property. | Land | Improvement |
|---|---|---|---|---|
| 2025 | -- | $669,700 | $301,800 | $367,900 |
| 2024 | -- | $663,100 | $298,800 | $364,300 |
| 2023 | $0 | $602,800 | $271,400 | $331,400 |
| 2022 | $0 | $508,500 | $249,000 | $259,500 |
| 2021 | $0 | $497,500 | $224,800 | $272,700 |
| 2020 | $0 | $475,500 | $214,900 | $260,600 |
| 2019 | $0 | $447,500 | $202,700 | $244,800 |
| 2018 | $0 | $411,000 | $190,700 | $220,300 |
| 2017 | -- | $397,100 | $184,300 | $212,800 |
| 2016 | -- | $398,100 | $181,200 | $216,900 |
| 2015 | -- | $379,700 | $172,700 | $207,000 |
| 2014 | -- | $372,300 | $169,300 | $203,000 |
Map
- 50 Albion St
- 14 Richardson Ave
- 175 North Ave Unit 311
- 175 North Ave Unit 506
- 62 Foundry St Unit 312
- 62 Foundry St Unit 416
- 62 Foundry St Unit 315
- 62 Foundry St Unit 505
- 62 Foundry St Unit 305
- 62 Foundry St Unit 202
- 317 Main St Unit 7
- 15 Lafayette St Unit D
- 44 Church St
- 248 Albion St Unit 215
- 248 Albion St Unit 324
- 248 Albion St Unit 315
- 5 Ballister St Unit 523
- 22 Park St Unit 22A
- 22 Park St Unit B
- 22 Park St Unit A
- 86 Babson St Unit A
- 88 Albion St
- 85 Albion St
- 78 Albion St
- 74 Albion St
- 41 Richardson Ave Unit 2
- 41 Richardson Ave Unit 17
- 41 Richardson Ave Unit 12
- 41 Richardson Ave Unit 16
- 41 Richardson Ave Unit 5
- 89-8 Albion St
- 97 Albion St Unit 99
- 39 Richardson Ave Unit 4
- 39 Richardson Ave Unit 19
- 39 Richardson Ave Unit 3
- 39 Richardson Ave Unit 12
- 39 Richardson Ave
- 39 Richardson Ave Unit 15
- 98 Albion St
- 37 C Richardson Ave Unit C
Ask me questions while you tour the home.