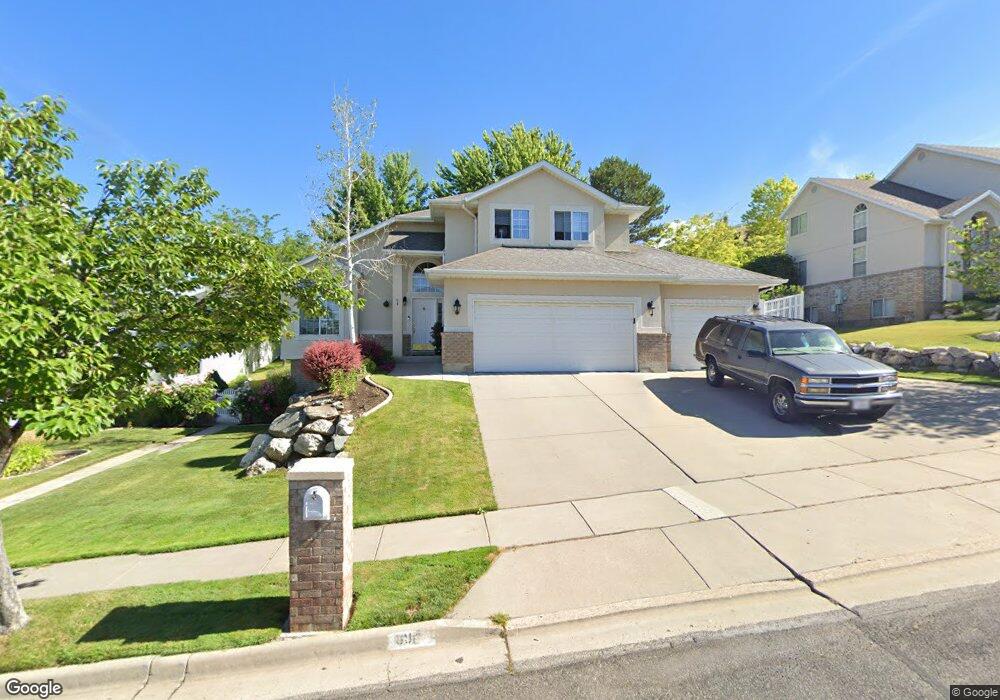
89 E 2050 N Centerville, UT 84014
Estimated Value: $701,000 - $739,000
5
Beds
5
Baths
3,398
Sq Ft
$211/Sq Ft
Est. Value
About This Home
This home is located at 89 E 2050 N, Centerville, UT 84014 and is currently estimated at $718,087, approximately $211 per square foot. 89 E 2050 N is a home located in Davis County with nearby schools including Reading School, Centerville Jr High, and Viewmont High School.
Ownership History
Date
Name
Owned For
Owner Type
Purchase Details
Closed on
Oct 31, 2025
Sold by
Ojediran Adeyinka
Bought by
Ojediran Adeyinka and Ojediran Oluwafunmilayo
Current Estimated Value
Home Financials for this Owner
Home Financials are based on the most recent Mortgage that was taken out on this home.
Original Mortgage
$281,500
Outstanding Balance
$281,500
Interest Rate
5.49%
Mortgage Type
New Conventional
Estimated Equity
$436,587
Purchase Details
Closed on
May 4, 2022
Sold by
Schekel Gary K
Bought by
Gary K Schekel Trust
Purchase Details
Closed on
Oct 27, 2006
Sold by
Bianchi Catherine and Deyoung Joanne C
Bought by
Schekel Gary K and Schekel Jeanette
Purchase Details
Closed on
Jun 10, 2003
Sold by
Bianchi Daniel L
Bought by
Bianchi Catherine and Deyoung Joanne C
Home Financials for this Owner
Home Financials are based on the most recent Mortgage that was taken out on this home.
Original Mortgage
$241,000
Interest Rate
4.62%
Mortgage Type
Purchase Money Mortgage
Create a Home Valuation Report for This Property
The Home Valuation Report is an in-depth analysis detailing your home's value as well as a comparison with similar homes in the area
Purchase History
| Date | Buyer | Sale Price | Title Company |
|---|---|---|---|
| Ojediran Adeyinka | -- | Meridian Title | |
| Ojediran Adeyinka | -- | Meridian Title | |
| Gary K Schekel Trust | -- | None Listed On Document | |
| Schekel Gary K | -- | First American Title | |
| Bianchi Catherine | -- | First American Title | |
| Bianchi Catherine | -- | Security Title Insurance Age |
Source: Public Records
Mortgage History
| Date | Status | Borrower | Loan Amount |
|---|---|---|---|
| Open | Ojediran Adeyinka | $281,500 | |
| Previous Owner | Bianchi Catherine | $241,000 |
Source: Public Records
Tax History
| Year | Tax Paid | Tax Assessment Tax Assessment Total Assessment is a certain percentage of the fair market value that is determined by local assessors to be the total taxable value of land and additions on the property. | Land | Improvement |
|---|---|---|---|---|
| 2025 | $4,375 | $342,100 | $177,604 | $164,496 |
| 2024 | $3,790 | $332,750 | $161,118 | $171,632 |
| 2023 | $3,419 | $566,000 | $262,338 | $303,662 |
| 2022 | $3,585 | $328,900 | $132,862 | $196,038 |
| 2021 | $3,202 | $456,000 | $204,955 | $251,045 |
| 2020 | $2,868 | $407,000 | $199,108 | $207,892 |
| 2019 | $2,860 | $399,000 | $196,006 | $202,994 |
| 2018 | $2,646 | $366,000 | $181,681 | $184,319 |
| 2016 | $2,241 | $173,580 | $62,970 | $110,610 |
| 2015 | $2,213 | $162,635 | $62,970 | $99,665 |
| 2014 | $2,426 | $179,786 | $62,970 | $116,816 |
| 2013 | -- | $151,015 | $55,590 | $95,425 |
Source: Public Records
Map
Nearby Homes
- 5 W Summerhill Ln
- 136 W Summerhill Ln
- 283 W Summerhill Ln
- 286 W Summerhill Ln
- 461 W Summerhill Ln
- 586 W 1950 N
- 551 W Summerhill Ln
- 687 W 2025 N
- 354 S 525 W
- 393 S 525 W
- 374 S 525 W
- 373 S 525 W
- 386 S 525 W
- 2132 N 725 W
- 2136 N 725 W
- 2340 N 650 W
- 1692 Willow Creek Cir
- 1549 N 400 W
- 145 Ford Canyon Dr
- 23 E 1500 S
- 89 E 2050 N Unit Mother-in-law baseme
- 89 E 2050 N Unit Main House
- 101 E 2050 N
- 79 E 2050 N
- 122 Rock Manor Dr
- 114 Rock Manor Dr
- 88 E 2050 N
- 117 E 2050 N
- 69 E 2050 N
- 128 Rock Manor Dr
- 98 E 2050 N
- 76 E 2050 N
- 108 Rock Manor Dr
- 112 E 2050 N
- 66 E 2050 N
- 59 E 2050 N
- 135 E 2050 N
- 138 Rock Manor Dr
- 1995 N 100 E
- 2075 N 150 E
Your Personal Tour Guide
Ask me questions while you tour the home.