89 Tyler St Attleboro, MA 02703
Estimated Value: $477,000 - $495,440
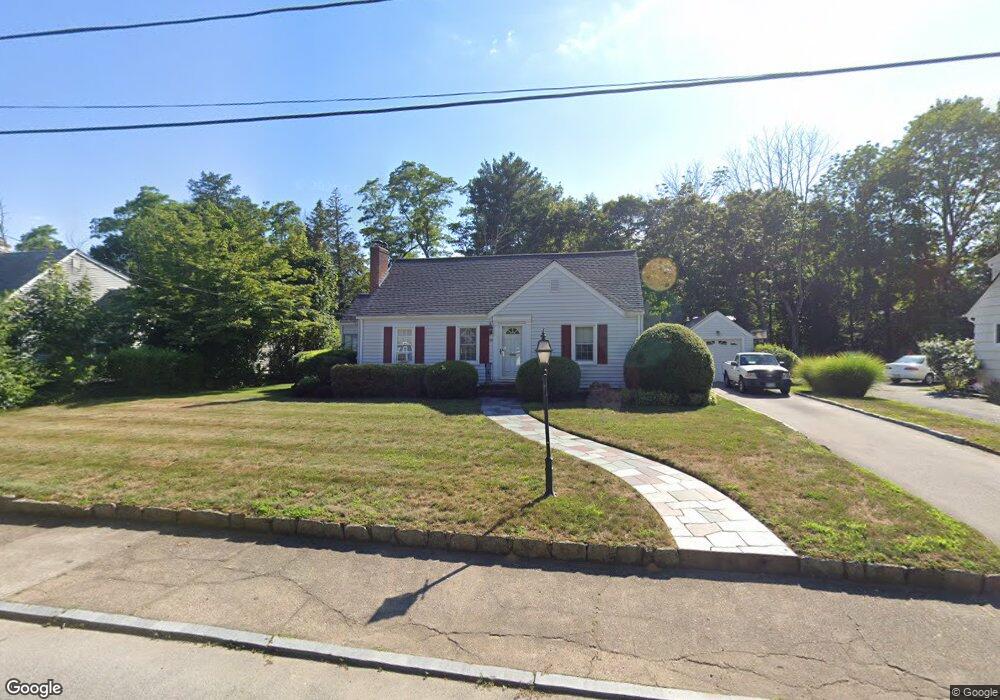
About This Home
This home is located at 89 Tyler St, Attleboro, MA 02703 and is currently estimated at $486,360, approximately $349 per square foot. 89 Tyler St is a home located in Bristol County with nearby schools including Peter Thacher Elementary School, Wamsutta Middle School, and Attleboro High School.
Ownership History
We collect this data history from publicly available records. To have your information removed, we recommend requesting removal directly through your county’s website.
Purchase Details
Home Values in the Area
Average Home Value in this Area
Purchase History
We collect this data history from publicly available records. To have your information removed, we recommend requesting removal directly through your county’s website.
| Date | Buyer | Sale Price | Title Company |
|---|---|---|---|
| -- | -- |
Mortgage History
We collect this data history from publicly available records. To have your information removed, we recommend requesting removal directly through your county’s website.
| Date | Status | Borrower | Loan Amount |
|---|---|---|---|
| Open | $35,000 | ||
| Open | $51,000 | ||
| Closed | $43,076 | ||
| Closed | $55,000 |
Tax History
We collect this data history from publicly available records. To have your information removed, we recommend requesting removal directly through your county’s website.
| Year | Tax Paid | Tax Assessment Tax Assessment Total Assessment is a certain percentage of the fair market value that is determined by local assessors to be the total taxable value of land and additions on the property. | Land | Improvement |
|---|---|---|---|---|
| 2025 | $5,287 | $421,300 | $163,800 | $257,500 |
| 2024 | $4,932 | $387,400 | $147,300 | $240,100 |
| 2023 | $4,839 | $353,500 | $148,800 | $204,700 |
| 2022 | $4,612 | $319,200 | $141,700 | $177,500 |
| 2021 | $4,508 | $304,600 | $136,300 | $168,300 |
| 2020 | $4,276 | $293,700 | $130,200 | $163,500 |
| 2019 | $3,973 | $280,600 | $127,700 | $152,900 |
| 2018 | $3,816 | $257,500 | $124,100 | $133,400 |
| 2017 | $3,658 | $251,400 | $120,900 | $130,500 |
| 2016 | $3,340 | $225,400 | $103,000 | $122,400 |
| 2015 | $3,173 | $215,700 | $103,000 | $112,700 |
| 2014 | $3,096 | $208,500 | $98,100 | $110,400 |
Map
- 429 S Main St
- 429 S Main St Unit 11
- 59 Marlise Dr
- 10 Dailey St Unit H
- 18 Dailey St Unit H
- 75 Grant St
- 154 Thacher St
- 13 Oakdale St
- 142 Fisher St Unit B
- 1 Bellmore St
- 0 Joseph St Unit 73469304
- 0 Tulip Unit 73534486
- 0 Tulip Unit 73534508
- 0 Tulip Unit 73534483
- 0 Tulip Unit 73534502
- 22 Fisher St
- 43 Marjorie St
- 640 Oakhill Ave
- 222-226 S St
- 326 Thacher St
Ask me questions while you tour the home.