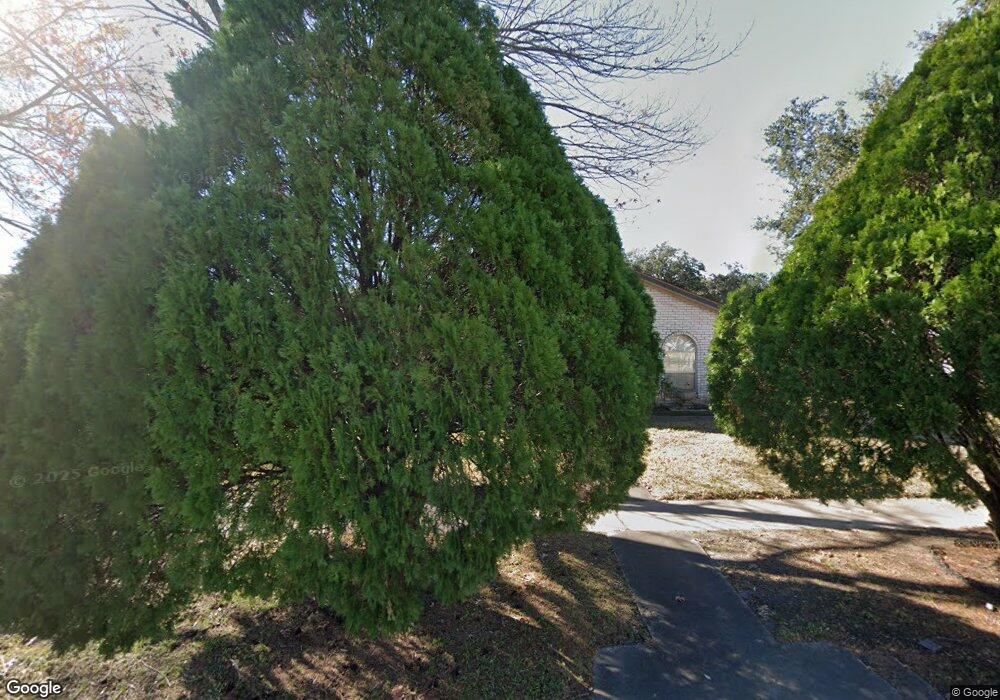
8911 Sharpview Dr Houston, TX 77036
Chinatown NeighborhoodEstimated Value: $308,000 - $322,762
About This Home
This home is located at 8911 Sharpview Dr, Houston, TX 77036 and is currently estimated at $313,941, approximately $133 per square foot. 8911 Sharpview Dr is a home located in Harris County with nearby schools including Ed White Elementary School, Sugar Grove Academy, and Sharpstown High School.
Ownership History
We collect this data history from publicly available records. To have your information removed, we recommend requesting removal directly through your county’s website.
Purchase Details
Purchase Details
Home Financials for this Owner
Home Financials are based on the most recent Mortgage that was taken out on this home.Home Values in the Area
Average Home Value in this Area
Purchase History
We collect this data history from publicly available records. To have your information removed, we recommend requesting removal directly through your county’s website.
| Date | Buyer | Sale Price | Title Company |
|---|---|---|---|
| -- | None Available | ||
| -- | Texas American Title Company |
Mortgage History
We collect this data history from publicly available records. To have your information removed, we recommend requesting removal directly through your county’s website.
| Date | Status | Borrower | Loan Amount |
|---|---|---|---|
| Closed | $68,000 |
Tax History
We collect this data history from publicly available records. To have your information removed, we recommend requesting removal directly through your county’s website.
| Year | Tax Paid | Tax Assessment Tax Assessment Total Assessment is a certain percentage of the fair market value that is determined by local assessors to be the total taxable value of land and additions on the property. | Land | Improvement |
|---|---|---|---|---|
| 2025 | $124 | $314,113 | $99,360 | $214,753 |
| 2024 | $116 | $308,352 | $99,360 | $208,992 |
| 2023 | $116 | $338,411 | $99,360 | $239,051 |
| 2022 | $6,226 | $286,073 | $57,960 | $228,113 |
| 2021 | $5,781 | $250,936 | $49,680 | $201,256 |
| 2020 | $5,641 | $225,498 | $49,680 | $175,818 |
| 2019 | $5,719 | $219,090 | $49,680 | $169,410 |
| 2018 | $359 | $205,751 | $49,680 | $156,071 |
| 2017 | $5,269 | $205,751 | $49,680 | $156,071 |
| 2016 | $4,790 | $205,751 | $49,680 | $156,071 |
| 2015 | $668 | $185,771 | $49,680 | $136,091 |
| 2014 | $668 | $167,355 | $49,680 | $117,675 |
Map
- 8834 Sandstone St
- 9011 Roos Rd
- 7230 Pella Dr
- 8818 Roos Rd
- 8826 Rowan Ln
- 8910 Neff St
- 7103 Pella Dr
- 9235 Sharpview Dr
- 8926 Langdon Ln
- 9238 Stroud Dr
- 9231 Neff St
- 8530 Roos Rd
- 7915 Kendalia Dr
- 8811 Leader St
- 7911 Kendalia Dr
- 7903 Augustine Dr
- 7902 La Roche Ln
- 9243 Westwood Village Dr Unit 53
- 9263 Westwood Village Dr Unit 50
- 7927 Pella Dr
- 8915 Sharpview Dr
- 8907 Sharpview Dr
- 9010 Sandstone St
- 9014 Sandstone St
- 8919 Sharpview Dr
- 8903 Sharpview Dr
- 9006 Sandstone St
- 9018 Sandstone St
- 8914 Sharpview Dr
- 8918 Sharpview Dr
- 8906 Sharpview Dr
- 9002 Sandstone St
- 8923 Sharpview Dr
- 9022 Sandstone St
- 8922 Sharpview Dr
- 8902 Sharpview Dr
- 8926 Sharpview Dr
- 9026 Sandstone St
- 9003 Sharpview Dr
- 8843 Sharpview Dr
Ask me questions while you tour the home.