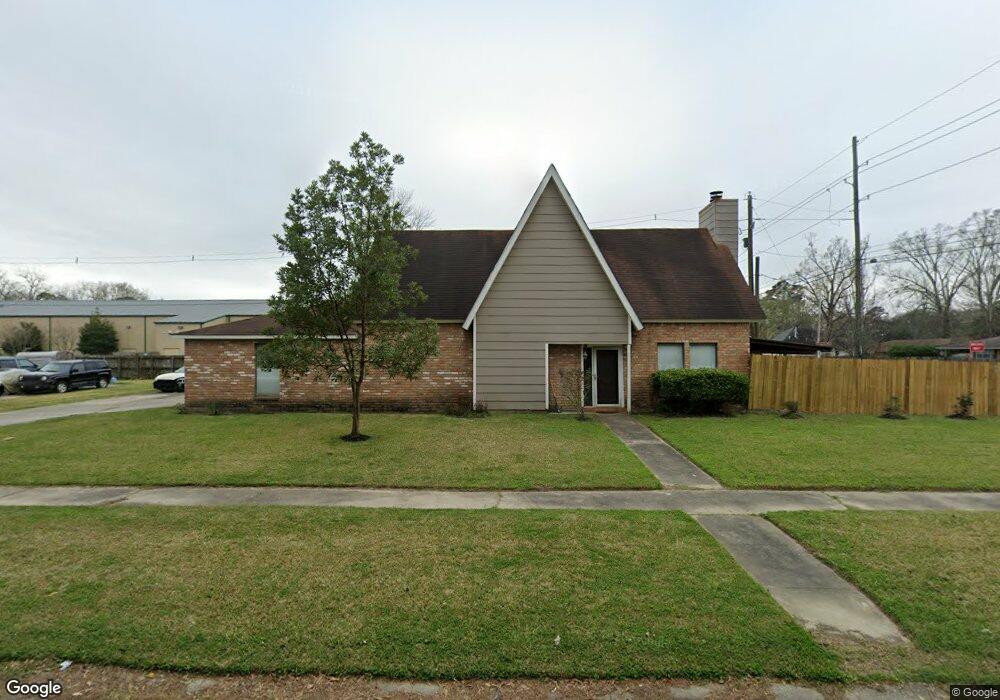
8916 Highpoint Rd Baton Rouge, LA 70810
Wildwood NeighborhoodEstimated Value: $208,820 - $252,000
3
Beds
2
Baths
1,529
Sq Ft
$153/Sq Ft
Est. Value
About This Home
This home is located at 8916 Highpoint Rd, Baton Rouge, LA 70810 and is currently estimated at $233,205, approximately $152 per square foot. 8916 Highpoint Rd is a home located in East Baton Rouge Parish with nearby schools including Westdale Middle School, Tara High School, and South Baton Rouge Charter Academy.
Ownership History
Date
Name
Owned For
Owner Type
Purchase Details
Closed on
Jun 15, 2017
Sold by
Dornier Daniel Francis
Bought by
Portera Shawn M
Current Estimated Value
Home Financials for this Owner
Home Financials are based on the most recent Mortgage that was taken out on this home.
Original Mortgage
$164,957
Outstanding Balance
$134,619
Interest Rate
3.87%
Mortgage Type
FHA
Estimated Equity
$98,586
Purchase Details
Closed on
Sep 29, 2009
Sold by
Hyde Donnell M
Bought by
Dornier Daniel F
Home Financials for this Owner
Home Financials are based on the most recent Mortgage that was taken out on this home.
Original Mortgage
$152,192
Interest Rate
5.36%
Mortgage Type
FHA
Purchase Details
Closed on
Oct 20, 2000
Sold by
Rambo Rambo Clarence P
Bought by
Hyde Donnell M and Hyde Yvette R
Home Financials for this Owner
Home Financials are based on the most recent Mortgage that was taken out on this home.
Original Mortgage
$95,370
Interest Rate
7.95%
Mortgage Type
VA
Create a Home Valuation Report for This Property
The Home Valuation Report is an in-depth analysis detailing your home's value as well as a comparison with similar homes in the area
Home Values in the Area
Average Home Value in this Area
Purchase History
| Date | Buyer | Sale Price | Title Company |
|---|---|---|---|
| Portera Shawn M | $168,000 | Commerce Title & Abstract Co | |
| Dornier Daniel F | $155,000 | -- | |
| Hyde Donnell M | $93,500 | -- |
Source: Public Records
Mortgage History
| Date | Status | Borrower | Loan Amount |
|---|---|---|---|
| Open | Portera Shawn M | $164,957 | |
| Previous Owner | Dornier Daniel F | $152,192 | |
| Previous Owner | Hyde Donnell M | $95,370 |
Source: Public Records
Tax History
| Year | Tax Paid | Tax Assessment Tax Assessment Total Assessment is a certain percentage of the fair market value that is determined by local assessors to be the total taxable value of land and additions on the property. | Land | Improvement |
|---|---|---|---|---|
| 2025 | $1,275 | $16,800 | $1,200 | $15,600 |
| 2024 | $1,275 | $16,800 | $1,200 | $15,600 |
| 2023 | $1,179 | $16,800 | $1,200 | $15,600 |
| 2022 | $2,006 | $16,800 | $1,200 | $15,600 |
| 2021 | $1,960 | $16,800 | $1,200 | $15,600 |
| 2020 | $1,947 | $16,800 | $1,200 | $15,600 |
| 2019 | $2,035 | $16,800 | $1,200 | $15,600 |
| 2018 | $2,010 | $16,800 | $1,200 | $15,600 |
| 2017 | $1,854 | $15,500 | $1,200 | $14,300 |
| 2016 | $1,030 | $15,500 | $1,200 | $14,300 |
| 2015 | $1,032 | $15,500 | $1,200 | $14,300 |
| 2014 | $1,029 | $15,500 | $1,200 | $14,300 |
| 2013 | -- | $15,500 | $1,200 | $14,300 |
Source: Public Records
Map
Nearby Homes
- 9046 Kingcrest Pkwy
- 9004 Boone Dr
- 623 Staring Ln
- 488 Magnolia Wood Ave
- 264 Magnolia Wood Ave
- 134 Magnolia Wood Ave
- 8930 Highland Rd
- 9385 Kingcrest Pkwy
- 9216 Magnolia Leaf Ave
- 114 Magnolia Wood Ave
- 124 Magnolia Wood Ave
- 476 Magnolia Wood Ave
- 212 Magnolia Wood Ave
- 8510 Highland Rd
- 9431 Kevel Dr
- 9444 Kingcrest Pkwy
- 9421 Worthington Lake Ave
- 242 Highland Creek Pkwy
- 9004 Southlawn Dr
- 9034 Southlawn Dr
- 8916 High Point Rd
- 8926 High Point Rd
- 460 Staring Ln
- 8936 High Point Rd
- 454 Staring Ln
- 439 Staring Ln
- 447 Staring Ln
- 8920 Nolen Dr
- 8950 Nolen Dr
- 459 Staring Ln
- 427 Staring Ln
- 8980 Nolen Dr
- 9022 High Point Rd
- 9013 High Point Rd
- 467 Staring Ln
- 419 Staring Ln
- 402 Staring Ln
- 477 Staring Ln
- 8915 Nolen Dr
- 9042 High Point Rd
Your Personal Tour Guide
Ask me questions while you tour the home.