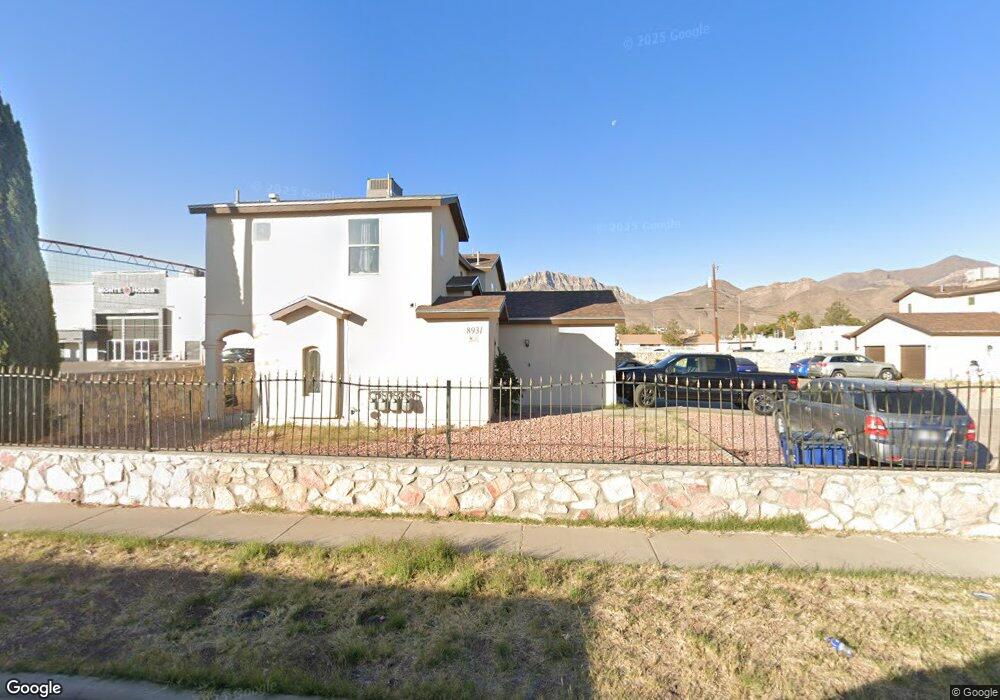
8931 Marks St Unit 1 - 8 El Paso, TX 79904
Mountain View NeighborhoodEstimated Value: $146,000 - $561,372
12
Beds
8
Baths
6,496
Sq Ft
$62/Sq Ft
Est. Value
About This Home
This home is located at 8931 Marks St Unit 1 - 8, El Paso, TX 79904 and is currently estimated at $403,843, approximately $62 per square foot. 8931 Marks St Unit 1 - 8 is a home located in El Paso County with nearby schools including Moye Elementary School, Canyon Hills Middle School, and Irvin High School.
Create a Home Valuation Report for This Property
The Home Valuation Report is an in-depth analysis detailing your home's value as well as a comparison with similar homes in the area
Home Values in the Area
Average Home Value in this Area
Tax History
| Year | Tax Paid | Tax Assessment Tax Assessment Total Assessment is a certain percentage of the fair market value that is determined by local assessors to be the total taxable value of land and additions on the property. | Land | Improvement |
|---|---|---|---|---|
| 2025 | $13,153 | $497,507 | $59,279 | $438,228 |
| 2024 | $12,914 | $497,507 | $59,279 | $438,228 |
| 2023 | $12,914 | $440,765 | $26,945 | $413,820 |
| 2022 | $10,801 | $364,881 | $26,945 | $337,936 |
| 2021 | $9,593 | $307,237 | $26,945 | $280,292 |
| 2020 | $8,903 | $289,672 | $26,945 | $262,727 |
| 2019 | $8,671 | $289,672 | $26,945 | $262,727 |
| 2018 | $8,721 | $294,661 | $26,945 | $267,716 |
| 2017 | $8,300 | $294,661 | $26,945 | $267,716 |
| 2016 | $8,418 | $298,853 | $26,945 | $271,908 |
| 2015 | $8,177 | $298,853 | $26,945 | $271,908 |
| 2014 | $8,177 | $298,853 | $26,945 | $271,908 |
Source: Public Records
Map
Nearby Homes
- 4605 Arlen Ave
- 8903 Strand Ln
- 8920 Kenneth St
- 8715 Lawson St
- 4801 Chisos Ln
- 9204 Igoe Place
- 4728 Sierra Madre Dr
- 4733 Tetons Dr
- 4713 Gt Powers Dr
- 4943 Aiken Ln
- 8440 Dyer St
- 9040 Diana Dr
- 8811 Neptune St
- 9119 Mount Etna Dr
- 4951 Rutherford Dr
- 8308 Mount Latona Dr
- 4543 Croton Cir
- 8809 Mercury St Unit A&B
- 9400 Stonewall Rd
- 8948 Matterhorn Dr
- 8931 Marks St
- 8931 Marks St Unit All
- 8931 Marks St Unit 1to 4
- 8931 Marks St Unit 1
- 8931 Marks St Unit A
- 8931 Marks St Unit B
- 8931 Marks St Unit D
- 8931 Marks St Unit 4
- 8931 Marks St Unit C
- 8935 Marks St
- 8935 Marks St Unit ALL
- 8935 Marks St Unit B
- 8935 Marks St Unit D
- 8935 Marks St Unit C
- 8939 Marks St Unit A
- 8939 Marks St Unit A,B,C
- 8939 Marks St
- 8939 Marks St Unit B
- 8939 Marks St Unit 3
- 8939 Marks St Unit C
Your Personal Tour Guide
Ask me questions while you tour the home.