Estimated Value: $71,000 - $92,000
2
Beds
1
Bath
770
Sq Ft
$109/Sq Ft
Est. Value
About This Home
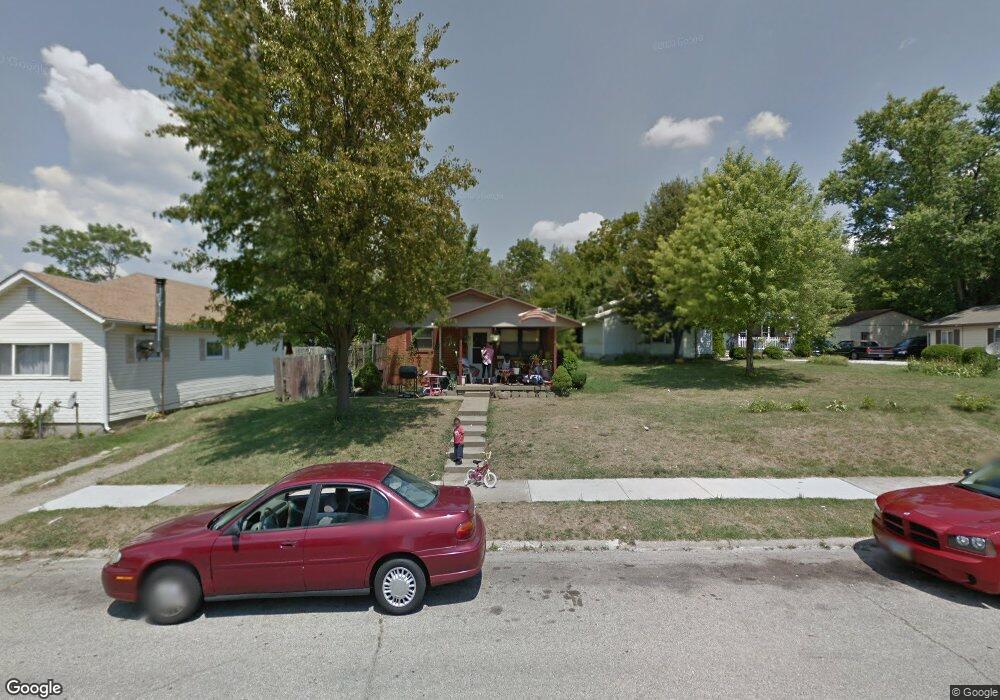
This home is located at 894 E 2nd St, Xenia, OH 45385 and is currently estimated at $84,092, approximately $109 per square foot. 894 E 2nd St is a home located in Greene County with nearby schools including Xenia High School, Summit Academy Community School for Alternative Learners - Xenia, and Legacy Christian Academy.
Ownership History
Date
Name
Owned For
Owner Type
Purchase Details
Closed on
May 10, 2016
Bought by
Clay Mary E
Current Estimated Value
Purchase Details
Closed on
Jul 11, 1996
Sold by
Sumpter Priscilla A
Bought by
Clay Virgil D and Clay E
Home Financials for this Owner
Home Financials are based on the most recent Mortgage that was taken out on this home.
Original Mortgage
$32,300
Interest Rate
8.09%
Mortgage Type
New Conventional
Create a Home Valuation Report for This Property
The Home Valuation Report is an in-depth analysis detailing your home's value as well as a comparison with similar homes in the area
Home Values in the Area
Average Home Value in this Area
Purchase History
| Date | Buyer | Sale Price | Title Company |
|---|---|---|---|
| Clay Mary E | -- | -- | |
| Clay Virgil D | $34,000 | -- |
Source: Public Records
Mortgage History
| Date | Status | Borrower | Loan Amount |
|---|---|---|---|
| Previous Owner | Clay Virgil D | $32,300 |
Source: Public Records
Tax History
| Year | Tax Paid | Tax Assessment Tax Assessment Total Assessment is a certain percentage of the fair market value that is determined by local assessors to be the total taxable value of land and additions on the property. | Land | Improvement |
|---|---|---|---|---|
| 2025 | $663 | $15,220 | $2,050 | $13,170 |
| 2024 | $663 | $15,220 | $2,050 | $13,170 |
| 2023 | $651 | $15,220 | $2,050 | $13,170 |
| 2022 | $550 | $10,970 | $1,860 | $9,110 |
| 2021 | $558 | $10,970 | $1,860 | $9,110 |
| 2020 | $534 | $10,970 | $1,860 | $9,110 |
| 2019 | $554 | $10,710 | $1,910 | $8,800 |
| 2018 | $556 | $10,710 | $1,910 | $8,800 |
| 2017 | $540 | $10,710 | $1,910 | $8,800 |
| 2016 | $545 | $10,300 | $1,910 | $8,390 |
| 2015 | $547 | $10,300 | $1,910 | $8,390 |
| 2014 | $524 | $10,300 | $1,910 | $8,390 |
Source: Public Records
Map
Nearby Homes
Your Personal Tour Guide
Ask me questions while you tour the home.