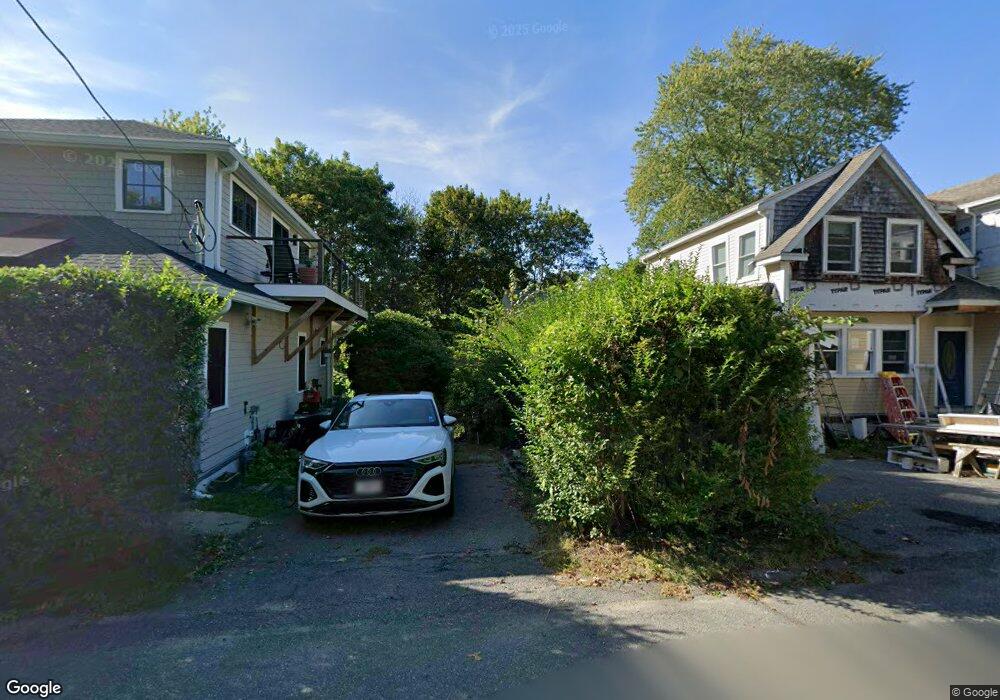
8R Decatur St Gloucester, MA 01930
East Gloucester NeighborhoodEstimated Value: $515,000 - $746,000
3
Beds
1
Bath
810
Sq Ft
$733/Sq Ft
Est. Value
About This Home
This home is located at 8R Decatur St, Gloucester, MA 01930 and is currently estimated at $594,025, approximately $733 per square foot. 8R Decatur St is a home located in Essex County with nearby schools including East Gloucester Elementary School, Ralph B O'maley Middle School, and Gloucester High School.
Ownership History
Date
Name
Owned For
Owner Type
Purchase Details
Closed on
Jan 14, 2000
Sold by
Taylor Marianne K and Foley Michael S
Bought by
Cameron John B and Conneman Ann M
Current Estimated Value
Home Financials for this Owner
Home Financials are based on the most recent Mortgage that was taken out on this home.
Original Mortgage
$147,600
Interest Rate
7.79%
Mortgage Type
Purchase Money Mortgage
Create a Home Valuation Report for This Property
The Home Valuation Report is an in-depth analysis detailing your home's value as well as a comparison with similar homes in the area
Home Values in the Area
Average Home Value in this Area
Purchase History
| Date | Buyer | Sale Price | Title Company |
|---|---|---|---|
| Cameron John B | $164,000 | -- |
Source: Public Records
Mortgage History
| Date | Status | Borrower | Loan Amount |
|---|---|---|---|
| Open | Cameron John B | $140,000 | |
| Closed | Cameron John B | $147,600 | |
| Previous Owner | Cameron John B | $25,000 |
Source: Public Records
Tax History
| Year | Tax Paid | Tax Assessment Tax Assessment Total Assessment is a certain percentage of the fair market value that is determined by local assessors to be the total taxable value of land and additions on the property. | Land | Improvement |
|---|---|---|---|---|
| 2025 | $4,396 | $452,300 | $213,800 | $238,500 |
| 2024 | $4,302 | $442,100 | $203,600 | $238,500 |
| 2023 | $4,001 | $377,800 | $181,800 | $196,000 |
| 2022 | $3,908 | $333,200 | $154,500 | $178,700 |
| 2021 | $3,844 | $309,000 | $140,500 | $168,500 |
| 2020 | $3,741 | $303,400 | $140,500 | $162,900 |
| 2019 | $3,509 | $276,500 | $140,500 | $136,000 |
| 2018 | $3,372 | $260,800 | $140,500 | $120,300 |
| 2017 | $3,241 | $245,700 | $133,800 | $111,900 |
| 2016 | $3,098 | $227,600 | $134,300 | $93,300 |
| 2015 | $3,015 | $220,900 | $134,300 | $86,600 |
Source: Public Records
Map
Nearby Homes
- 70 Bass Ave
- 6R Neptune Place Unit 1
- 16 Highland St
- 197 E Main St Unit 1
- 72 Friend St
- 14R Spring St Unit 3
- 23 Mount Vernon St
- 60 Rocky Neck Ave Unit 202
- 73 Rocky Neck Ave Unit 2
- 191 Main St Unit 2A
- 1 Wonson St
- 10 Fremont St
- 113 Pleasant St
- 28 Eastern Point Rd
- 33 Maplewood Ave Unit 310
- 5 Grapevine Rd
- 35 Middle St Unit 4
- 27 Addison St
- 6 Arthur St
- 40 Middle St Unit 3a
Your Personal Tour Guide
Ask me questions while you tour the home.