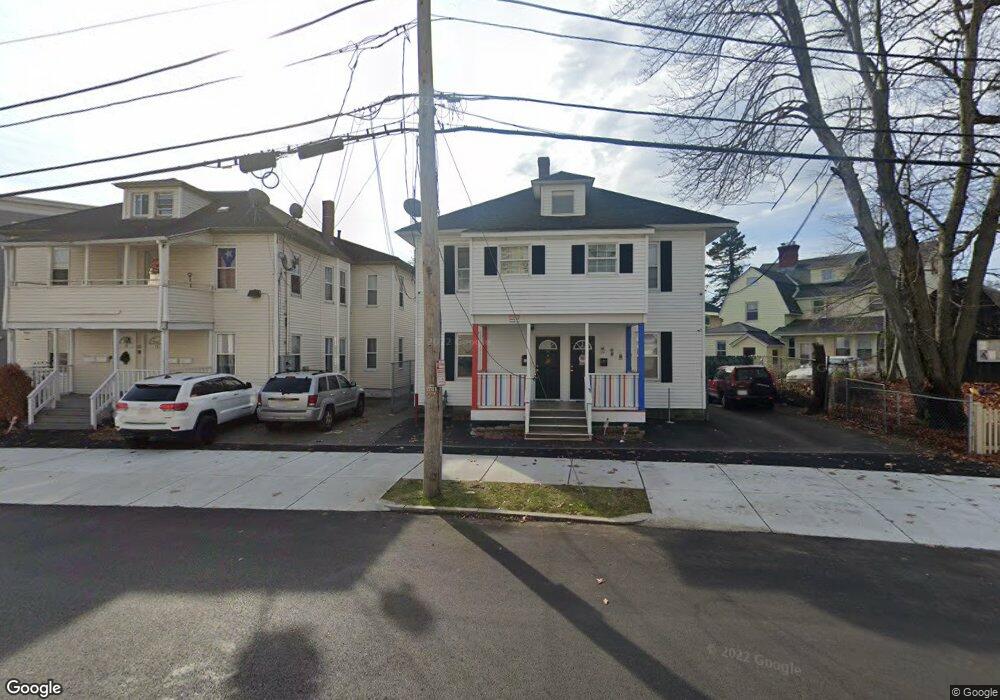
9-11 Loring St Lawrence, MA 01843
South Common NeighborhoodEstimated Value: $579,905 - $911,000
4
Beds
2
Baths
1,898
Sq Ft
$387/Sq Ft
Est. Value
About This Home
This home is located at 9-11 Loring St, Lawrence, MA 01843 and is currently estimated at $734,476, approximately $386 per square foot. 9-11 Loring St is a home located in Essex County with nearby schools including John Breen School, South Lawrence East Elementary School, and School For Exceptional Studies.
Ownership History
Date
Name
Owned For
Owner Type
Purchase Details
Closed on
Mar 18, 2022
Sold by
Almonte Juan and Almonte Alejandrina A
Bought by
Nunez-Flores Olga and Payano-Dedifo Nelsi
Current Estimated Value
Home Financials for this Owner
Home Financials are based on the most recent Mortgage that was taken out on this home.
Original Mortgage
$589,132
Outstanding Balance
$541,805
Interest Rate
3.55%
Mortgage Type
FHA
Estimated Equity
$192,671
Purchase Details
Closed on
Mar 26, 2021
Sold by
Almonte Juan F
Bought by
Almonte Juan F and Almonte Alejandrina A
Home Financials for this Owner
Home Financials are based on the most recent Mortgage that was taken out on this home.
Original Mortgage
$244,275
Interest Rate
3.45%
Mortgage Type
New Conventional
Purchase Details
Closed on
Mar 7, 2014
Sold by
Welch John
Bought by
Almonte Juan
Home Financials for this Owner
Home Financials are based on the most recent Mortgage that was taken out on this home.
Original Mortgage
$241,544
Interest Rate
4.39%
Mortgage Type
FHA
Purchase Details
Closed on
Jul 29, 2010
Sold by
Cif Realty Llc
Bought by
Pena Luz E and Gil-Reinoso Celine
Purchase Details
Closed on
Sep 18, 2009
Sold by
Peluso Thomas
Bought by
Cif Realty Llc
Purchase Details
Closed on
Aug 13, 2004
Sold by
Reyes Rafael
Bought by
Gosselin Gary
Purchase Details
Closed on
Nov 7, 2002
Sold by
Winter Kimberly
Bought by
Otero Florencia
Purchase Details
Closed on
Aug 28, 2001
Sold by
Raposo Carlos
Bought by
Winter Kimberly
Purchase Details
Closed on
Nov 19, 1998
Sold by
Andover Bk
Bought by
Raposo Carlos
Create a Home Valuation Report for This Property
The Home Valuation Report is an in-depth analysis detailing your home's value as well as a comparison with similar homes in the area
Home Values in the Area
Average Home Value in this Area
Purchase History
| Date | Buyer | Sale Price | Title Company |
|---|---|---|---|
| Nunez-Flores Olga | $600,000 | None Available | |
| Almonte Juan F | -- | None Available | |
| Almonte Juan | -- | None Available | |
| Almonte Juan | $246,000 | -- | |
| Pena Luz E | $218,000 | -- | |
| Pena Luz | $218,000 | -- | |
| Cif Realty Llc | -- | -- | |
| Peluso Thomas | $86,500 | -- | |
| Bank Of New York Mello | -- | -- | |
| Bank Of New York Mello | -- | -- | |
| Cif Realty Llc | -- | -- | |
| Peluso Thomas | $86,500 | -- | |
| Bank Of New York Mello | -- | -- | |
| Gosselin Gary | $20,000 | -- | |
| Gosselin Gary | $20,000 | -- | |
| Otero Florencia | $178,000 | -- | |
| Otero Florencia | $178,000 | -- | |
| Winter Kimberly | $130,000 | -- | |
| Winter Kimberly M | $130,000 | -- | |
| Raposo Carlos | $110,000 | -- | |
| Raposo Carlos Tomas | $110,000 | -- |
Source: Public Records
Mortgage History
| Date | Status | Borrower | Loan Amount |
|---|---|---|---|
| Open | Nunez-Flores Olga | $589,132 | |
| Previous Owner | Almonte Juan | $244,275 | |
| Previous Owner | Almonte Juan | $241,544 |
Source: Public Records
Tax History
| Year | Tax Paid | Tax Assessment Tax Assessment Total Assessment is a certain percentage of the fair market value that is determined by local assessors to be the total taxable value of land and additions on the property. | Land | Improvement |
|---|---|---|---|---|
| 2025 | $4,742 | $538,900 | $92,000 | $446,900 |
| 2024 | $4,622 | $499,700 | $99,500 | $400,200 |
| 2023 | $4,274 | $420,700 | $92,300 | $328,400 |
| 2022 | $4,761 | $416,200 | $83,700 | $332,500 |
| 2021 | $4,626 | $377,000 | $83,700 | $293,300 |
| 2020 | $4,447 | $357,800 | $79,300 | $278,500 |
| 2019 | $4,703 | $343,800 | $65,900 | $277,900 |
| 2018 | $4,280 | $298,900 | $62,400 | $236,500 |
| 2017 | $3,944 | $257,100 | $59,000 | $198,100 |
| 2016 | $3,899 | $251,400 | $48,600 | $202,800 |
| 2015 | $3,827 | $253,100 | $48,600 | $204,500 |
Source: Public Records
Map
Nearby Homes
- 151-153 Bailey St
- 161-167 S Union St
- 119 Andover St
- 100 Bailey St Unit 1
- 100 Union St
- 143 Foster St
- 356-360 S Union St
- 46-46A Dorchester St
- 18 Winthrop Ave
- 7 Stevens Ct
- 27-29 Dorchester St
- 52 Howard St
- 11 Cambridge St
- 31 Garfield St
- 219 Waverley Rd
- 76 Allston St
- 82 S Broadway
- 27 Woodland Ct
- 89 Newbury St Unit 89B
- 11 Lawrence St Unit 606
- 9 Loring St Unit 11
- 17 Loring St Unit 2
- 17 Loring St Unit 1
- 15 Loring St Unit 1
- 15 Loring St Unit 2
- 14 Osgood St
- 16 Osgood St
- 114 Market St
- 91 Greenfield St Unit 93
- 95 Greenfield St Unit 97
- 91-93 Greenfield St
- 101 Greenfield St
- 119 Market St
- 115 Market St
- 102 Greenfield St
- 100 Greenfield St
- 109 Market St Unit 111
- 98 Greenfield St
- 96 Greenfield St
- 105 Market St Unit 107
Your Personal Tour Guide
Ask me questions while you tour the home.