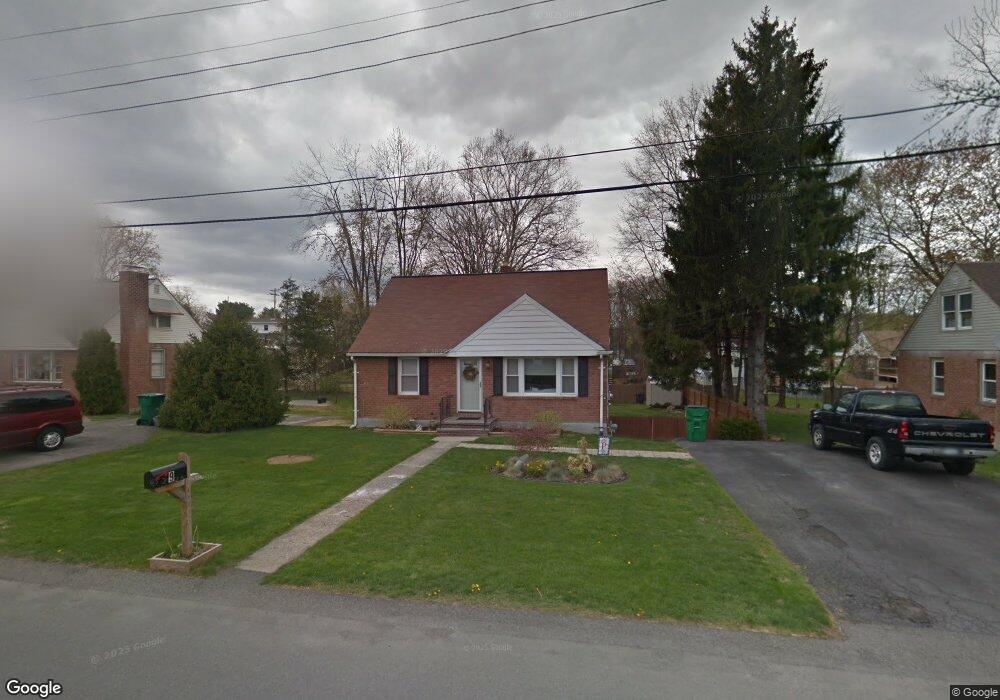
9 Anthony Dr Poughkeepsie, NY 12601
Estimated Value: $343,000 - $450,000
4
Beds
2
Baths
2,080
Sq Ft
$192/Sq Ft
Est. Value
About This Home
This home is located at 9 Anthony Dr, Poughkeepsie, NY 12601 and is currently estimated at $399,058, approximately $191 per square foot. 9 Anthony Dr is a home located in Dutchess County with nearby schools including Spackenkill High School, Poughkeepsie Day School, and Poughkeepsie Community Seventh-Day Adventist School.
Ownership History
Date
Name
Owned For
Owner Type
Purchase Details
Closed on
Nov 4, 2009
Sold by
Hirning Devin
Bought by
Pifer Raymond
Current Estimated Value
Home Financials for this Owner
Home Financials are based on the most recent Mortgage that was taken out on this home.
Original Mortgage
$233,617
Outstanding Balance
$128,932
Interest Rate
5.06%
Mortgage Type
Purchase Money Mortgage
Estimated Equity
$270,126
Purchase Details
Closed on
Aug 2, 1999
Sold by
Carpenter Edward J
Bought by
Hirning Devin
Create a Home Valuation Report for This Property
The Home Valuation Report is an in-depth analysis detailing your home's value as well as a comparison with similar homes in the area
Home Values in the Area
Average Home Value in this Area
Purchase History
| Date | Buyer | Sale Price | Title Company |
|---|---|---|---|
| Pifer Raymond | $237,000 | -- | |
| Hirning Devin | $123,700 | Lisa J Felicissimo |
Source: Public Records
Mortgage History
| Date | Status | Borrower | Loan Amount |
|---|---|---|---|
| Open | Pifer Raymond | $233,617 |
Source: Public Records
Tax History
| Year | Tax Paid | Tax Assessment Tax Assessment Total Assessment is a certain percentage of the fair market value that is determined by local assessors to be the total taxable value of land and additions on the property. | Land | Improvement |
|---|---|---|---|---|
| 2024 | $9,270 | $320,500 | $64,800 | $255,700 |
| 2023 | $21,031 | $320,500 | $64,800 | $255,700 |
| 2019 | $6,093 | $205,000 | $58,900 | $146,100 |
Source: Public Records
Map
Nearby Homes
- 15 E Dogwood Dr
- 2343 South Rd
- 1 Essex Rd
- 16 Darlene Dr
- 11 Darlene Dr
- 16 Kingwood Ln
- 51 S Gate Dr
- 36 Hasbrouck Dr
- 18 Cardinal Dr
- 5 Croft Rd
- 17 Tall Tree Ln
- 27 Tall Tree Ln
- 15 Laffin Ln
- 621 Sheafe Rd Unit 61
- 621 Sheafe Rd Unit 76
- 621 Sheafe Rd Unit LOT 8
- 220 Wilbur Blvd
- 45 Old Farms Rd
- 567 Sheafe Rd Unit 10
- 7 Brookland Farms Rd
Your Personal Tour Guide
Ask me questions while you tour the home.