9 Avalon Dr Attleboro, MA 02703
Estimated Value: $676,000 - $769,749
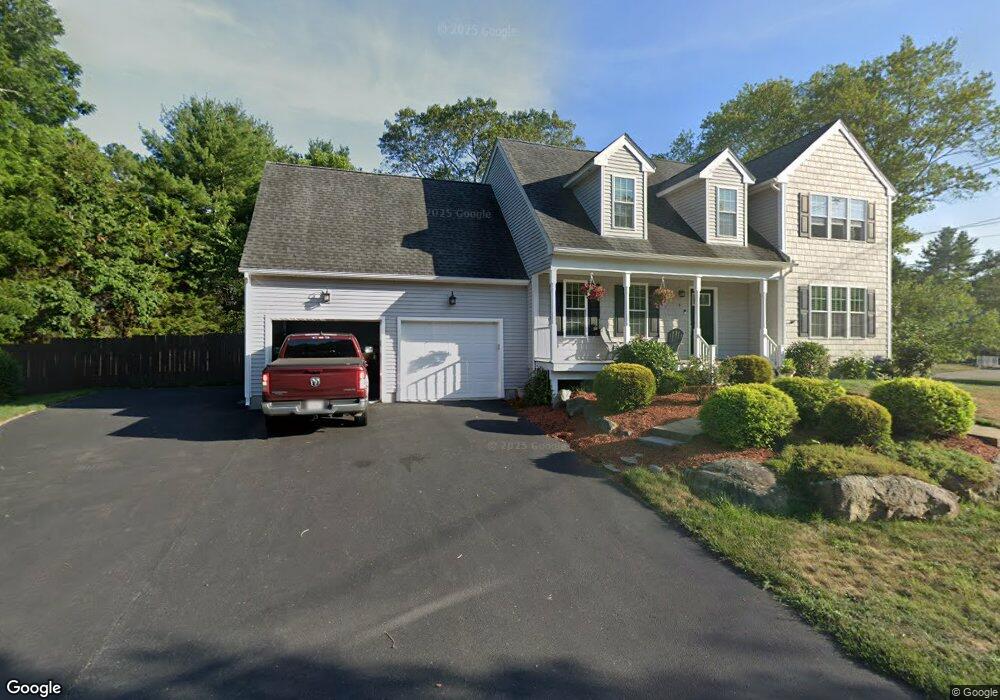
About This Home
This home is located at 9 Avalon Dr, Attleboro, MA 02703 and is currently estimated at $739,437, approximately $392 per square foot. 9 Avalon Dr is a home located in Bristol County with nearby schools including Hyman Fine Elementary School, Wamsutta Middle School, and Attleboro High School.
Ownership History
We collect this data history from publicly available records. To have your information removed, we recommend requesting removal directly through your county’s website.
Purchase Details
Home Financials for this Owner
Home Financials are based on the most recent Mortgage that was taken out on this home.Purchase Details
Home Financials for this Owner
Home Financials are based on the most recent Mortgage that was taken out on this home.Purchase Details
Home Values in the Area
Average Home Value in this Area
Purchase History
We collect this data history from publicly available records. To have your information removed, we recommend requesting removal directly through your county’s website.
| Date | Buyer | Sale Price | Title Company |
|---|---|---|---|
| $655,000 | None Available | ||
| $401,900 | -- | ||
| -- | -- |
Mortgage History
We collect this data history from publicly available records. To have your information removed, we recommend requesting removal directly through your county’s website.
| Date | Status | Borrower | Loan Amount |
|---|---|---|---|
| Open | $622,250 | ||
| Previous Owner | $401,900 |
Tax History
We collect this data history from publicly available records. To have your information removed, we recommend requesting removal directly through your county’s website.
| Year | Tax Paid | Tax Assessment Tax Assessment Total Assessment is a certain percentage of the fair market value that is determined by local assessors to be the total taxable value of land and additions on the property. | Land | Improvement |
|---|---|---|---|---|
| 2025 | $8,498 | $677,100 | $145,300 | $531,800 |
| 2024 | $8,225 | $646,100 | $145,300 | $500,800 |
| 2023 | $7,380 | $539,100 | $132,100 | $407,000 |
| 2022 | $6,994 | $484,000 | $125,900 | $358,100 |
| 2021 | $6,832 | $461,600 | $121,100 | $340,500 |
| 2020 | $6,539 | $449,100 | $117,500 | $331,600 |
| 2019 | $6,376 | $450,300 | $115,300 | $335,000 |
| 2018 | $6,107 | $412,100 | $111,900 | $300,200 |
| 2017 | $3,399 | $233,600 | $111,900 | $121,700 |
| 2016 | $1,626 | $109,700 | $109,700 | $0 |
| 2015 | $1,614 | $109,700 | $109,700 | $0 |
| 2014 | $2,351 | $158,300 | $104,500 | $53,800 |
Map
- 112 Smith St
- 23 Smith St
- 113 Slater St
- 217 Dean St
- 38 Dean St
- 1 Round Farm Rd
- 11 Autumn Ln
- 52 Round Farm Rd
- 9 Round Farm Rd
- 14 Wilmarth St
- 0 W Hodges St
- 20 Mine Brook Rd
- 587 Tremont St
- 67 Handy St
- 125 John Scott Blvd
- 84 Fairview Ave
- 366 & 0 Pike Ave
- 36 Catherine Dr
- 1003 Oakhill Ave Unit 3
- 66 S Worcester St Unit E
Ask me questions while you tour the home.