9 Beech St Braintree, MA 02184
East Braintree NeighborhoodEstimated Value: $627,000 - $722,000
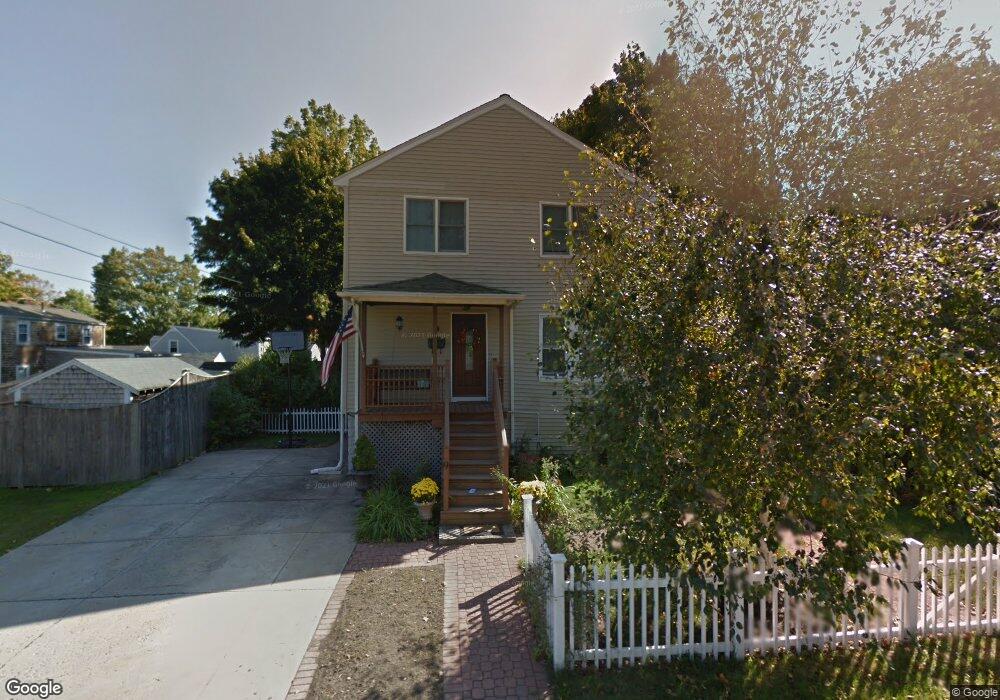
About This Home
This home is located at 9 Beech St, Braintree, MA 02184 and is currently estimated at $687,420, approximately $388 per square foot. 9 Beech St is a home located in Norfolk County with nearby schools including Braintree High School, Step Ahead Kindergarten, and Sacred Heart Elementary School.
Ownership History
We collect this data history from publicly available records. To have your information removed, we recommend requesting removal directly through your county’s website.
Purchase Details
Home Financials for this Owner
Home Financials are based on the most recent Mortgage that was taken out on this home.Home Values in the Area
Average Home Value in this Area
Purchase History
We collect this data history from publicly available records. To have your information removed, we recommend requesting removal directly through your county’s website.
| Date | Buyer | Sale Price | Title Company |
|---|---|---|---|
| $125,000 | -- | ||
| $125,000 | -- |
Mortgage History
We collect this data history from publicly available records. To have your information removed, we recommend requesting removal directly through your county’s website.
| Date | Status | Borrower | Loan Amount |
|---|---|---|---|
| Open | $111,500 | ||
| Closed | $112,500 |
Tax History
We collect this data history from publicly available records. To have your information removed, we recommend requesting removal directly through your county’s website.
| Year | Tax Paid | Tax Assessment Tax Assessment Total Assessment is a certain percentage of the fair market value that is determined by local assessors to be the total taxable value of land and additions on the property. | Land | Improvement |
|---|---|---|---|---|
| 2025 | $6,420 | $643,300 | $331,000 | $312,300 |
| 2024 | $5,733 | $604,700 | $304,900 | $299,800 |
| 2023 | $5,488 | $562,300 | $278,700 | $283,600 |
| 2022 | $5,249 | $527,500 | $243,900 | $283,600 |
| 2021 | $4,855 | $487,900 | $220,400 | $267,500 |
| 2020 | $4,613 | $467,800 | $200,300 | $267,500 |
| 2019 | $4,427 | $438,800 | $200,300 | $238,500 |
| 2018 | $4,241 | $402,400 | $174,200 | $228,200 |
| 2017 | $4,124 | $384,000 | $165,500 | $218,500 |
| 2016 | $3,980 | $362,500 | $156,800 | $205,700 |
| 2015 | $3,886 | $351,000 | $153,300 | $197,700 |
| 2014 | $3,614 | $316,500 | $133,300 | $183,200 |
Map
- 296 Commercial St Unit 21
- 28 Hillcrest Rd
- 146 Hayward St
- 7 Somerville Ave
- 25 Fairmount Ave
- 27 Cindy Ln
- 16 Cotton Ave
- 51 Faxon St
- 24 Hillside Ave
- 30 Skyline Dr Unit 6
- 153 Commercial St Unit 5
- 27 Sun Valley Dr
- 485 Union St
- 37 Skyline Dr Unit 11
- 146 Burroughs Rd
- 41 Lantern Ln
- 37 Lantern Ln
- 792 Commercial St
- 115 Hawthorn Rd
- 25 W Howard St Unit G3
- 437 Commercial St
- 435 Commercial St
- 439 Commercial St
- 443 Commercial St
- 16 Magnolia St
- 32 Linden St
- 447 Commercial St
- 36 Linden St
- 429 Commercial St
- 22 Magnolia St
- 19 Beech St
- 17 Magnolia St
- 453 Commercial St
- 427 Commercial St
- 16 Linden St
- 12 Beech St
- 479 Commercial St
- 25 Linden St
- 14 Beech St
- 425 Commercial St
Ask me questions while you tour the home.