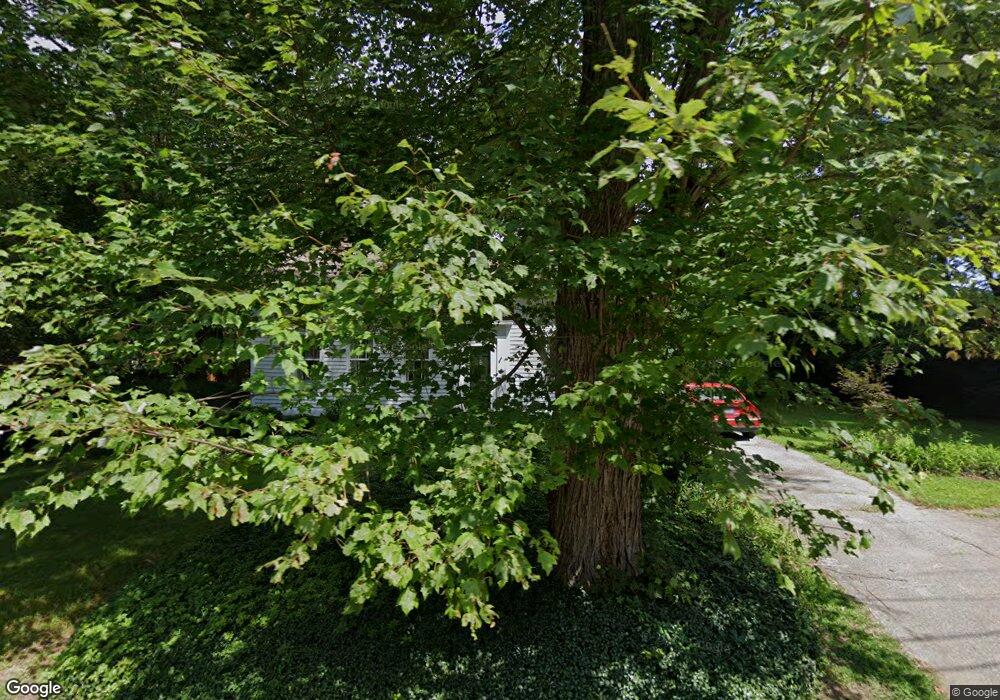
9 Charles St Centerbrook, CT 06409
Estimated Value: $382,452 - $561,000
About This Home
This home is located at 9 Charles St, Centerbrook, CT 06409 and is currently estimated at $472,613, approximately $301 per square foot. 9 Charles St is a home located in Middlesex County with nearby schools including Valley Regional High School.
Ownership History
We collect this data history from publicly available records. To have your information removed, we recommend requesting removal directly through your county’s website.
Purchase Details
Home Financials for this Owner
Home Financials are based on the most recent Mortgage that was taken out on this home.Home Values in the Area
Average Home Value in this Area
Purchase History
We collect this data history from publicly available records. To have your information removed, we recommend requesting removal directly through your county’s website.
| Date | Buyer | Sale Price | Title Company |
|---|---|---|---|
| $188,000 | -- |
Mortgage History
We collect this data history from publicly available records. To have your information removed, we recommend requesting removal directly through your county’s website.
| Date | Status | Borrower | Loan Amount |
|---|---|---|---|
| Open | $85,000 | ||
| Closed | $96,000 | ||
| Closed | $96,000 | ||
| Closed | $115,000 |
Tax History
We collect this data history from publicly available records. To have your information removed, we recommend requesting removal directly through your county’s website.
| Year | Tax Paid | Tax Assessment Tax Assessment Total Assessment is a certain percentage of the fair market value that is determined by local assessors to be the total taxable value of land and additions on the property. | Land | Improvement |
|---|---|---|---|---|
| 2025 | $3,838 | $206,000 | $66,000 | $140,000 |
| 2024 | $3,718 | $206,000 | $66,000 | $140,000 |
| 2023 | $3,682 | $163,000 | $61,600 | $101,400 |
| 2022 | $3,692 | $163,000 | $61,600 | $101,400 |
| 2021 | $7,437 | $163,000 | $61,600 | $101,400 |
| 2020 | $3,555 | $163,000 | $61,600 | $101,400 |
| 2019 | $3,529 | $163,000 | $61,600 | $101,400 |
| 2018 | $7,204 | $157,500 | $51,400 | $106,100 |
| 2017 | $3,459 | $157,500 | $51,400 | $106,100 |
| 2016 | $3,399 | $157,500 | $51,400 | $106,100 |
| 2015 | $3,320 | $157,500 | $51,400 | $106,100 |
| 2014 | $3,306 | $157,500 | $51,400 | $106,100 |
Map
- 33 Deep River Rd
- 108 Westbrook Rd
- 45 Falls River Dr
- 7 Mitchel Terrace
- 88 Main St
- 32 Sunset Terrace
- 130 Mares Hill Rd
- 37 Sunset Terrace
- 15 Sunset Terrace Unit 11
- 199 Westbrook Rd
- 7 Orchard Heights Rd
- 46 West Ave
- 14 Essex Glen Dr Unit 4
- 14 Essex Glen Dr Unit 9
- 17 Grandview Terrace
- 128 Mares Hill Rd
- 19 Blake St
- 101 N Main St
- 39 Prospect St
- 13 Mill Rd
Ask me questions while you tour the home.