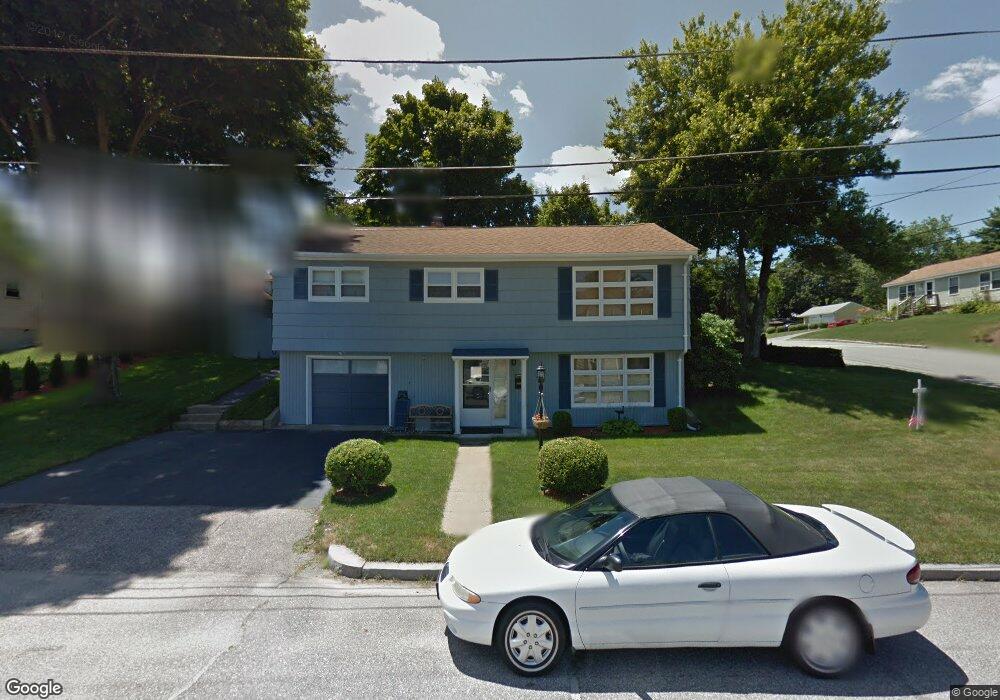
9 Denby St Woonsocket, RI 02895
East Woonsocket NeighborhoodEstimated Value: $369,261 - $424,000
3
Beds
1
Bath
1,360
Sq Ft
$294/Sq Ft
Est. Value
About This Home
This home is located at 9 Denby St, Woonsocket, RI 02895 and is currently estimated at $400,065, approximately $294 per square foot. 9 Denby St is a home located in Providence County with nearby schools including Woonsocket High School, Rise Prep Mayoral Academy Middle School, and Rise Prep Mayoral Academy.
Ownership History
Date
Name
Owned For
Owner Type
Purchase Details
Closed on
Nov 19, 2009
Sold by
Perez Rogelio A and Rodriguez Migdalia
Bought by
Allard David R and Allard Lori A
Current Estimated Value
Home Financials for this Owner
Home Financials are based on the most recent Mortgage that was taken out on this home.
Original Mortgage
$157,102
Outstanding Balance
$101,427
Interest Rate
4.86%
Mortgage Type
Purchase Money Mortgage
Estimated Equity
$298,638
Purchase Details
Closed on
Apr 10, 1990
Sold by
Lemek John S
Bought by
Chabot Joseph L
Create a Home Valuation Report for This Property
The Home Valuation Report is an in-depth analysis detailing your home's value as well as a comparison with similar homes in the area
Home Values in the Area
Average Home Value in this Area
Purchase History
| Date | Buyer | Sale Price | Title Company |
|---|---|---|---|
| Allard David R | $160,000 | -- | |
| Allard David R | $160,000 | -- | |
| Chabot Joseph L | $120,000 | -- |
Source: Public Records
Mortgage History
| Date | Status | Borrower | Loan Amount |
|---|---|---|---|
| Open | Chabot Joseph L | $157,102 | |
| Closed | Chabot Joseph L | $157,102 | |
| Previous Owner | Chabot Joseph L | $154,600 | |
| Previous Owner | Chabot Joseph L | $147,100 |
Source: Public Records
Tax History
| Year | Tax Paid | Tax Assessment Tax Assessment Total Assessment is a certain percentage of the fair market value that is determined by local assessors to be the total taxable value of land and additions on the property. | Land | Improvement |
|---|---|---|---|---|
| 2025 | $3,514 | $312,900 | $99,200 | $213,700 |
| 2024 | $3,309 | $227,600 | $94,200 | $133,400 |
| 2023 | $3,182 | $227,600 | $94,200 | $133,400 |
| 2022 | $3,182 | $227,600 | $94,200 | $133,400 |
| 2021 | $3,867 | $162,800 | $62,400 | $100,400 |
| 2020 | $3,907 | $162,800 | $62,400 | $100,400 |
| 2018 | $3,920 | $162,800 | $62,400 | $100,400 |
| 2017 | $3,805 | $126,400 | $55,400 | $71,000 |
| 2016 | $4,025 | $126,400 | $55,400 | $71,000 |
| 2015 | $4,624 | $126,400 | $55,400 | $71,000 |
| 2014 | $4,564 | $127,000 | $61,000 | $66,000 |
Source: Public Records
Map
Nearby Homes
- 7 Theresa Marie Ave
- 1088 Diamond Hill Rd
- 79 Saint Agnes Ave
- 89 Saint Agnes Ave
- 212 Saint Louis Ave
- 213 St Louis Ave
- 188 Saint Louis Ave
- 178 Saint Louis Ave
- 33 Achille St
- 202 Paine St
- 194 Paine St
- 568 Elm St
- 551 Wood Ave
- Lot 2 Pulaski Blvd
- 538 Wood Ave
- 727 Mendon Rd
- 108 Mill St Unit 104
- 90 Mill St Unit 202
- 92 Mill St Unit 303
- 311 Elm St
Your Personal Tour Guide
Ask me questions while you tour the home.