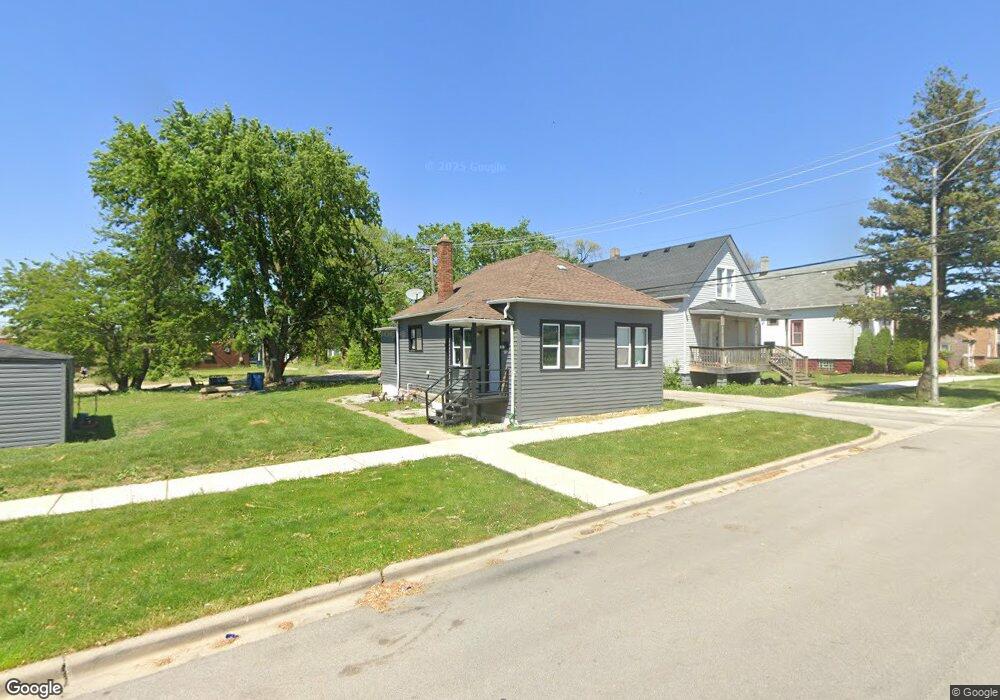
9 E 24th St Chicago Heights, IL 60411
Hungry Hill NeighborhoodEstimated Value: $60,000 - $105,000
2
Beds
1
Bath
867
Sq Ft
$97/Sq Ft
Est. Value
About This Home
This home is located at 9 E 24th St, Chicago Heights, IL 60411 and is currently estimated at $84,051, approximately $96 per square foot. 9 E 24th St is a home located in Cook County with nearby schools including Washington-Mckinley Elementary School, Bloom High School, and St Agnes School.
Ownership History
Date
Name
Owned For
Owner Type
Purchase Details
Closed on
Mar 7, 2011
Sold by
First Community Bank & Trust
Bought by
Minotti Joseph
Current Estimated Value
Purchase Details
Closed on
Aug 25, 2006
Sold by
Palos Bank & Trust Co
Bought by
Hansel Properties Inc
Home Financials for this Owner
Home Financials are based on the most recent Mortgage that was taken out on this home.
Original Mortgage
$68,600
Interest Rate
6.58%
Mortgage Type
Unknown
Purchase Details
Closed on
Feb 5, 1996
Sold by
Fatura Louis and Fatura Eugenia
Bought by
Palos Bank & Trust Company
Create a Home Valuation Report for This Property
The Home Valuation Report is an in-depth analysis detailing your home's value as well as a comparison with similar homes in the area
Home Values in the Area
Average Home Value in this Area
Purchase History
| Date | Buyer | Sale Price | Title Company |
|---|---|---|---|
| Minotti Joseph | -- | None Available | |
| Hansel Properties Inc | $45,000 | Stewart Title Of Illinois | |
| Palos Bank & Trust Company | -- | -- |
Source: Public Records
Mortgage History
| Date | Status | Borrower | Loan Amount |
|---|---|---|---|
| Previous Owner | Hansel Properties Inc | $68,600 |
Source: Public Records
Tax History
| Year | Tax Paid | Tax Assessment Tax Assessment Total Assessment is a certain percentage of the fair market value that is determined by local assessors to be the total taxable value of land and additions on the property. | Land | Improvement |
|---|---|---|---|---|
| 2025 | $2,454 | $4,619 | $1,093 | $3,526 |
| 2024 | $2,454 | $4,619 | $1,093 | $3,526 |
| 2023 | $2,658 | $4,619 | $1,093 | $3,526 |
| 2022 | $2,658 | $4,207 | $947 | $3,260 |
| 2021 | $2,553 | $4,206 | $947 | $3,259 |
| 2020 | $2,472 | $4,206 | $947 | $3,259 |
| 2019 | $2,765 | $4,801 | $874 | $3,927 |
| 2018 | $2,629 | $4,801 | $874 | $3,927 |
| 2017 | $2,513 | $4,801 | $874 | $3,927 |
| 2016 | $2,758 | $5,143 | $801 | $4,342 |
| 2015 | $2,727 | $5,143 | $801 | $4,342 |
| 2014 | $2,702 | $5,143 | $801 | $4,342 |
| 2013 | $2,787 | $5,508 | $801 | $4,707 |
Source: Public Records
Map
Nearby Homes
Your Personal Tour Guide
Ask me questions while you tour the home.