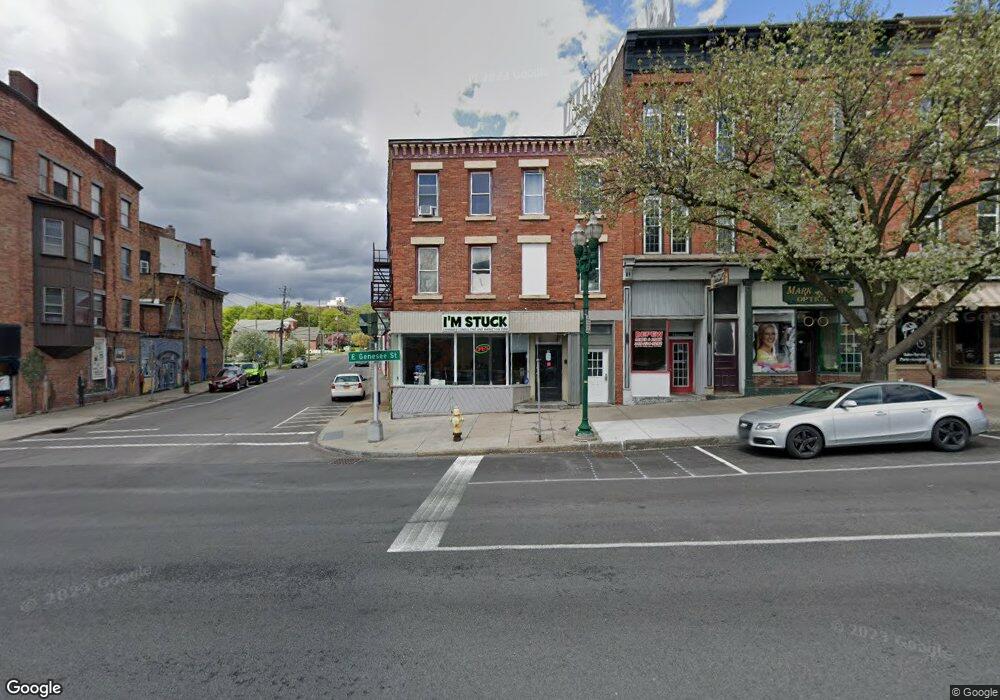
9 E Genesee St Auburn, NY 13021
Estimated Value: $130,612
Studio
--
Bath
2,500
Sq Ft
$52/Sq Ft
Est. Value
About This Home
This home is located at 9 E Genesee St, Auburn, NY 13021 and is currently estimated at $130,612, approximately $52 per square foot. 9 E Genesee St is a home located in Cayuga County with nearby schools including Auburn Junior High School, Auburn High School, and St Joseph School.
Ownership History
Date
Name
Owned For
Owner Type
Purchase Details
Closed on
Oct 6, 2022
Sold by
Grillo Companies Inc
Bought by
Capflow Capital Llc
Current Estimated Value
Home Financials for this Owner
Home Financials are based on the most recent Mortgage that was taken out on this home.
Original Mortgage
$142,500
Outstanding Balance
$107,305
Interest Rate
9%
Mortgage Type
New Conventional
Estimated Equity
$23,307
Purchase Details
Closed on
Jul 30, 2015
Sold by
Larham Frederck S
Bought by
Grillo Companies Inc
Home Financials for this Owner
Home Financials are based on the most recent Mortgage that was taken out on this home.
Original Mortgage
$56,000
Interest Rate
4.09%
Mortgage Type
Commercial
Purchase Details
Closed on
Oct 26, 2011
Sold by
Larham Frederick S and Brown John P
Bought by
Larham Frederick S
Purchase Details
Closed on
Mar 25, 2004
Sold by
Brown John P
Bought by
Brown John P
Purchase Details
Closed on
Mar 21, 2002
Sold by
Gauthier Bernard
Bought by
Brown John P
Create a Home Valuation Report for This Property
The Home Valuation Report is an in-depth analysis detailing your home's value as well as a comparison with similar homes in the area
Home Values in the Area
Average Home Value in this Area
Purchase History
| Date | Buyer | Sale Price | Title Company |
|---|---|---|---|
| Capflow Capital Llc | $330,000 | -- | |
| Capflow Capital Llc | $330,000 | None Listed On Document | |
| Grillo Companies Inc | $70,000 | None Available | |
| Larham Frederick S | -- | None Available | |
| Brown John P | -- | Mark Venuti | |
| Brown John P | $45,000 | Christopher J Calabrese |
Source: Public Records
Mortgage History
| Date | Status | Borrower | Loan Amount |
|---|---|---|---|
| Open | Capflow Capital Llc | $142,500 | |
| Closed | Capflow Capital Llc | $142,500 | |
| Previous Owner | Grillo Companies Inc | $56,000 |
Source: Public Records
Tax History
| Year | Tax Paid | Tax Assessment Tax Assessment Total Assessment is a certain percentage of the fair market value that is determined by local assessors to be the total taxable value of land and additions on the property. | Land | Improvement |
|---|---|---|---|---|
| 2025 | $2,303 | $98,800 | $9,700 | $89,100 |
| 2024 | $2,303 | $98,800 | $9,700 | $89,100 |
| 2023 | $2,301 | $98,800 | $9,700 | $89,100 |
| 2022 | $2,280 | $98,800 | $9,700 | $89,100 |
| 2021 | $1,973 | $72,000 | $4,500 | $67,500 |
| 2020 | $1,948 | $72,000 | $4,500 | $67,500 |
| 2019 | $612 | $72,000 | $4,500 | $67,500 |
| 2018 | $1,977 | $72,000 | $4,500 | $67,500 |
| 2017 | $2,141 | $78,250 | $4,400 | $73,850 |
| 2016 | $2,959 | $78,250 | $13,000 | $65,250 |
| 2015 | $1,308 | $78,250 | $13,000 | $65,250 |
| 2014 | $1,308 | $78,250 | $13,000 | $65,250 |
Source: Public Records
Map
Nearby Homes
Your Personal Tour Guide
Ask me questions while you tour the home.