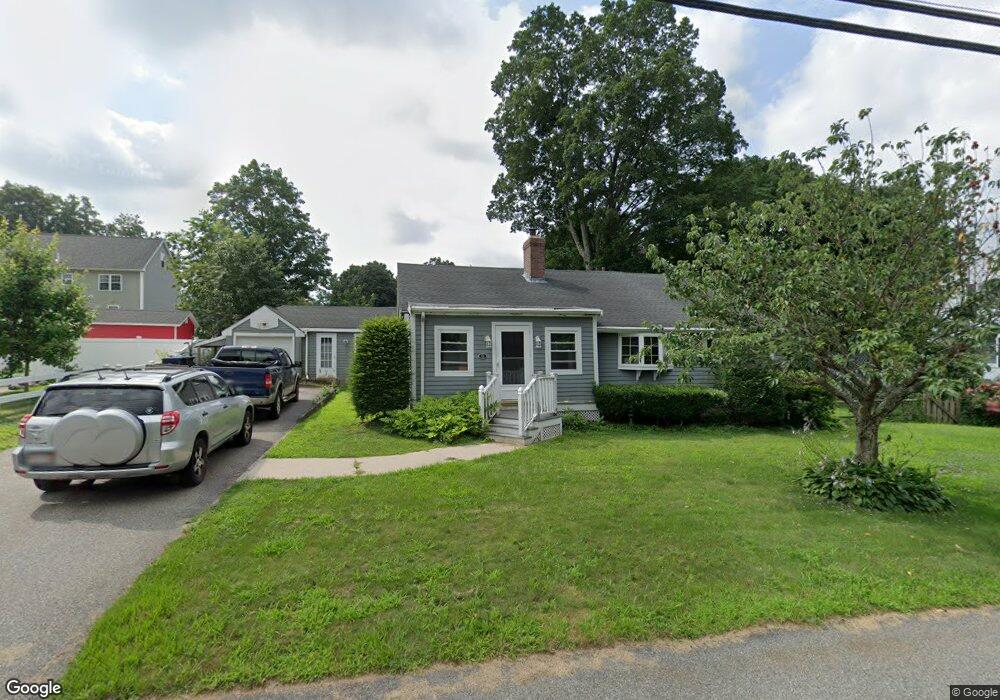
9 High St Wilmington, MA 01887
North Wilmington NeighborhoodEstimated Value: $644,000 - $874,000
About This Home
This home is located at 9 High St, Wilmington, MA 01887 and is currently estimated at $744,716, approximately $348 per square foot. 9 High St is a home located in Middlesex County with nearby schools including Wilmington Middle School, Wilmington High School, and Abundant Life Christian School and Childcare.
Ownership History
We collect this data history from publicly available records. To have your information removed, we recommend requesting removal directly through your county’s website.
Purchase Details
Purchase Details
Purchase Details
Home Values in the Area
Average Home Value in this Area
Purchase History
We collect this data history from publicly available records. To have your information removed, we recommend requesting removal directly through your county’s website.
| Date | Buyer | Sale Price | Title Company |
|---|---|---|---|
| $136,000 | -- | ||
| $140,000 | -- | ||
| $130,000 | -- |
Mortgage History
We collect this data history from publicly available records. To have your information removed, we recommend requesting removal directly through your county’s website.
| Date | Status | Borrower | Loan Amount |
|---|---|---|---|
| Open | $183,750 | ||
| Closed | $145,000 | ||
| Closed | $25,000 |
Tax History
We collect this data history from publicly available records. To have your information removed, we recommend requesting removal directly through your county’s website.
| Year | Tax Paid | Tax Assessment Tax Assessment Total Assessment is a certain percentage of the fair market value that is determined by local assessors to be the total taxable value of land and additions on the property. | Land | Improvement |
|---|---|---|---|---|
| 2025 | $7,502 | $655,200 | $272,800 | $382,400 |
| 2024 | $7,146 | $625,200 | $272,800 | $352,400 |
| 2023 | $6,960 | $582,900 | $248,000 | $334,900 |
| 2022 | $6,665 | $511,500 | $206,600 | $304,900 |
| 2021 | $6,812 | $492,200 | $187,800 | $304,400 |
| 2020 | $6,619 | $487,400 | $187,800 | $299,600 |
| 2019 | $6,685 | $486,200 | $178,900 | $307,300 |
| 2018 | $6,208 | $430,800 | $170,400 | $260,400 |
| 2017 | $5,779 | $399,900 | $162,700 | $237,200 |
| 2016 | $5,521 | $377,400 | $155,000 | $222,400 |
| 2015 | $5,157 | $358,900 | $155,000 | $203,900 |
| 2014 | $4,772 | $335,100 | $147,500 | $187,600 |
Map
- 438 Middlesex Ave
- 30 Marcia Rd
- 411 Salem St
- 4 Douglas Ave
- 4 Gowing Rd
- 33 Arlene Ave
- 4 Doane St
- 10 Seneca Ln
- 63 Faulkner Ave
- 146 Church St
- 19 Brattle St
- 70 McDonald Rd
- 54 McDonald Rd
- 23 Pomfret Rd
- 220 Martins Landing Unit 411
- 220 Martins Landing Unit 410
- 220 Martins Landing Unit 107
- 220 Martins Landing Unit 104
- 300 Martins Landing Unit 103
- 320 Martins Landing Unit 2501
Ask me questions while you tour the home.