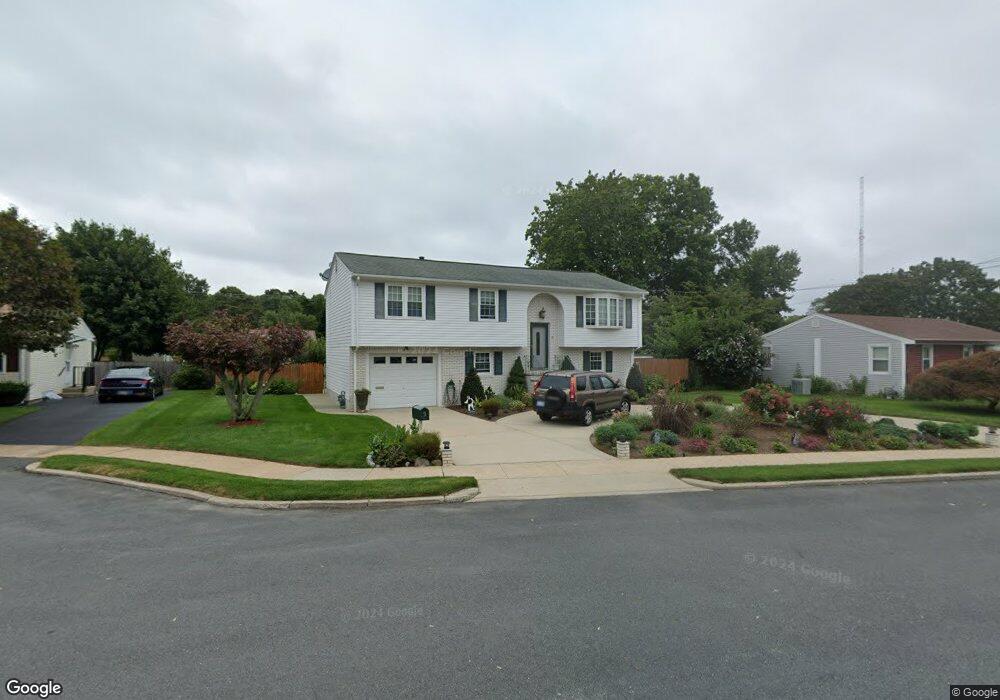
9 Julie Ann Cir Riverside, RI 02915
Riverside NeighborhoodEstimated Value: $456,250 - $528,000
3
Beds
2
Baths
1,838
Sq Ft
$266/Sq Ft
Est. Value
About This Home
This home is located at 9 Julie Ann Cir, Riverside, RI 02915 and is currently estimated at $488,313, approximately $265 per square foot. 9 Julie Ann Cir is a home located in Providence County with nearby schools including East Providence High School, St Mary Academy-Bay View, and Barrington Christian Academy.
Ownership History
Date
Name
Owned For
Owner Type
Purchase Details
Closed on
Dec 29, 2016
Sold by
Pires Maria L
Bought by
Pires Jose C
Current Estimated Value
Create a Home Valuation Report for This Property
The Home Valuation Report is an in-depth analysis detailing your home's value as well as a comparison with similar homes in the area
Home Values in the Area
Average Home Value in this Area
Purchase History
We collect this data history from publicly available records. To have your information removed, we recommend requesting removal directly through your county’s website.
| Date | Buyer | Sale Price | Title Company |
|---|---|---|---|
| Pires Jose C | -- | -- | |
| Pires Jose C | -- | -- |
Source: Public Records
Mortgage History
We collect this data history from publicly available records. To have your information removed, we recommend requesting removal directly through your county’s website.
| Date | Status | Borrower | Loan Amount |
|---|---|---|---|
| Previous Owner | Pires Jose C | $60,000 | |
| Previous Owner | Pires Jose C | $132,039 | |
| Previous Owner | Pires Jose C | $83,486 |
Source: Public Records
Tax History
| Year | Tax Paid | Tax Assessment Tax Assessment Total Assessment is a certain percentage of the fair market value that is determined by local assessors to be the total taxable value of land and additions on the property. | Land | Improvement |
|---|---|---|---|---|
| 2025 | $4,947 | $378,500 | $72,900 | $305,600 |
| 2024 | $5,387 | $351,400 | $60,800 | $290,600 |
| 2023 | $5,187 | $351,400 | $60,800 | $290,600 |
| 2022 | $5,338 | $244,200 | $50,500 | $193,700 |
| 2021 | $5,250 | $244,200 | $40,500 | $203,700 |
| 2020 | $5,028 | $244,200 | $40,500 | $203,700 |
| 2019 | $4,889 | $244,200 | $40,500 | $203,700 |
| 2018 | $5,354 | $234,000 | $48,200 | $185,800 |
| 2017 | $5,235 | $234,000 | $48,200 | $185,800 |
| 2016 | $5,209 | $234,000 | $48,200 | $185,800 |
| 2015 | $4,992 | $217,500 | $55,100 | $162,400 |
| 2014 | $4,992 | $217,500 | $55,100 | $162,400 |
Source: Public Records
Map
Nearby Homes
Your Personal Tour Guide
Ask me questions while you tour the home.