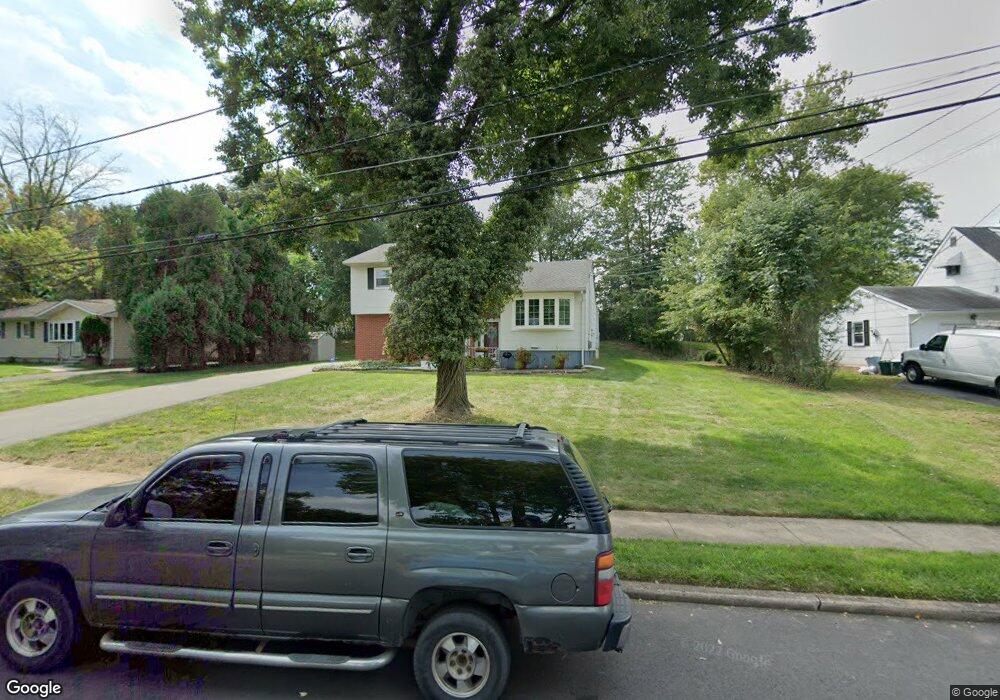
9 Knight Ln Ewing, NJ 08638
Braeburn Heights NeighborhoodEstimated Value: $323,823 - $467,000
Studio
--
Bath
1,748
Sq Ft
$240/Sq Ft
Est. Value
About This Home
This home is located at 9 Knight Ln, Ewing, NJ 08638 and is currently estimated at $419,706, approximately $240 per square foot. 9 Knight Ln is a home located in Mercer County with nearby schools including Ewing High School, Paul Robeson Charter School For The Humanities, and Trenton Stem-To-Civics Charter School.
Ownership History
Date
Name
Owned For
Owner Type
Purchase Details
Closed on
Jul 23, 1999
Sold by
Pennant Christeen
Bought by
Brown Patrice
Current Estimated Value
Home Financials for this Owner
Home Financials are based on the most recent Mortgage that was taken out on this home.
Original Mortgage
$119,479
Outstanding Balance
$33,705
Interest Rate
7.65%
Mortgage Type
FHA
Estimated Equity
$386,001
Purchase Details
Closed on
Jan 15, 1992
Sold by
Pennant Christine
Bought by
Pennant Chrsiteen
Create a Home Valuation Report for This Property
The Home Valuation Report is an in-depth analysis detailing your home's value as well as a comparison with similar homes in the area
Home Values in the Area
Average Home Value in this Area
Purchase History
| Date | Buyer | Sale Price | Title Company |
|---|---|---|---|
| Brown Patrice | $123,000 | -- | |
| Pennant Chrsiteen | -- | -- |
Source: Public Records
Mortgage History
| Date | Status | Borrower | Loan Amount |
|---|---|---|---|
| Open | Brown Patrice | $119,479 |
Source: Public Records
Tax History
| Year | Tax Paid | Tax Assessment Tax Assessment Total Assessment is a certain percentage of the fair market value that is determined by local assessors to be the total taxable value of land and additions on the property. | Land | Improvement |
|---|---|---|---|---|
| 2025 | $7,190 | $182,800 | $61,800 | $121,000 |
| 2024 | $6,758 | $182,800 | $61,800 | $121,000 |
| 2023 | $6,758 | $182,800 | $61,800 | $121,000 |
| 2022 | $6,575 | $182,800 | $61,800 | $121,000 |
| 2021 | $6,414 | $182,800 | $61,800 | $121,000 |
| 2020 | $6,323 | $182,800 | $61,800 | $121,000 |
| 2019 | $6,159 | $182,800 | $61,800 | $121,000 |
| 2018 | $6,666 | $126,200 | $39,600 | $86,600 |
| 2017 | $6,821 | $126,200 | $39,600 | $86,600 |
| 2016 | $6,729 | $126,200 | $39,600 | $86,600 |
| 2015 | $6,639 | $126,200 | $39,600 | $86,600 |
| 2014 | $6,622 | $126,200 | $39,600 | $86,600 |
Source: Public Records
Map
Nearby Homes
- 100 Carnine Ave
- 16 Bittersweet Rd
- 124 Hawthorne Ave
- 40 Arden Ave
- 27 Blossom Dr
- 23 Sundew Dr
- 140 Crescent Ave
- 24 Keswick Ave
- 42 Running Brook Rd
- 33 Sherbrooke Rd
- 20 Running Brook Rd
- 50 Groveland Ave
- 32 Stoneham Rd
- 104 King Ave
- 91 Groveland Ave
- 21 Buttonwood Dr
- 256 Ewingville Rd
- 161 Louisiana Ave
- 2 Shelburne Dr
- 56 Sherbrooke Rd
Your Personal Tour Guide
Ask me questions while you tour the home.