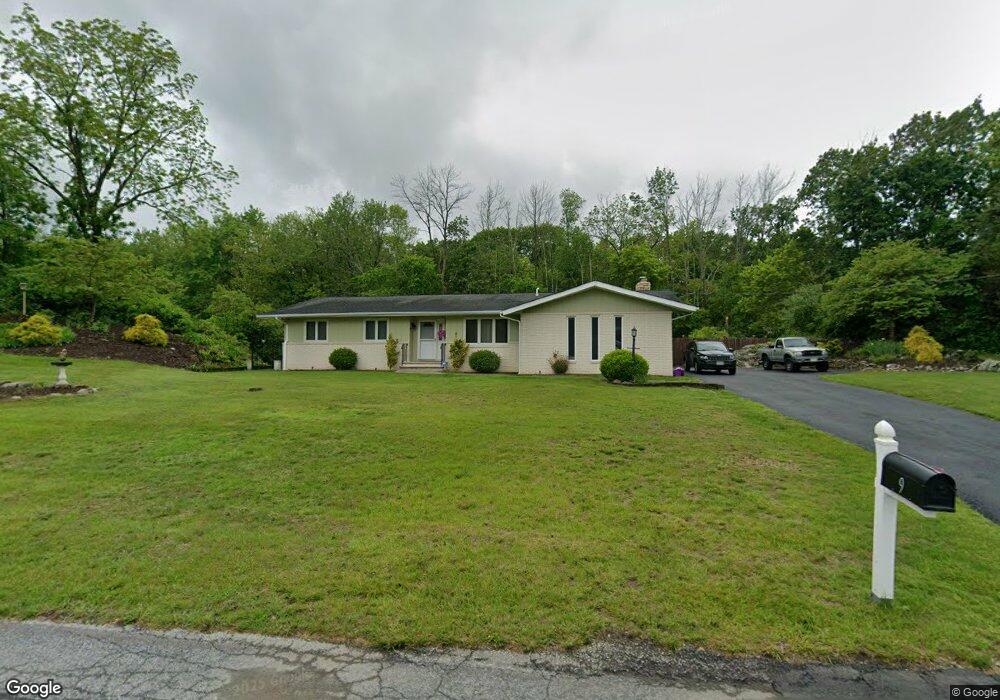
9 Knox Rd Newton, NJ 07860
Estimated Value: $411,330 - $580,000
Studio
--
Bath
1,649
Sq Ft
$306/Sq Ft
Est. Value
About This Home
This home is located at 9 Knox Rd, Newton, NJ 07860 and is currently estimated at $504,833, approximately $306 per square foot. 9 Knox Rd is a home located in Sussex County with nearby schools including Florence M. Burd School, Long Pond School, and Reverand George A. Brown School.
Ownership History
Date
Name
Owned For
Owner Type
Purchase Details
Closed on
Jul 15, 2005
Sold by
Rollin Kenneth J and Rollin Gina
Bought by
Centrella Gabe and Centrella Maria
Current Estimated Value
Home Financials for this Owner
Home Financials are based on the most recent Mortgage that was taken out on this home.
Original Mortgage
$302,500
Outstanding Balance
$156,683
Interest Rate
5.54%
Mortgage Type
Fannie Mae Freddie Mac
Estimated Equity
$348,150
Create a Home Valuation Report for This Property
The Home Valuation Report is an in-depth analysis detailing your home's value as well as a comparison with similar homes in the area
Home Values in the Area
Average Home Value in this Area
Purchase History
| Date | Buyer | Sale Price | Title Company |
|---|---|---|---|
| Centrella Gabe | $390,000 | -- |
Source: Public Records
Mortgage History
| Date | Status | Borrower | Loan Amount |
|---|---|---|---|
| Open | Centrella Gabe | $302,500 |
Source: Public Records
Tax History
| Year | Tax Paid | Tax Assessment Tax Assessment Total Assessment is a certain percentage of the fair market value that is determined by local assessors to be the total taxable value of land and additions on the property. | Land | Improvement |
|---|---|---|---|---|
| 2025 | $10,221 | $242,600 | $93,500 | $149,100 |
| 2024 | $9,852 | $242,600 | $93,500 | $149,100 |
Source: Public Records
Map
Nearby Homes
Your Personal Tour Guide
Ask me questions while you tour the home.