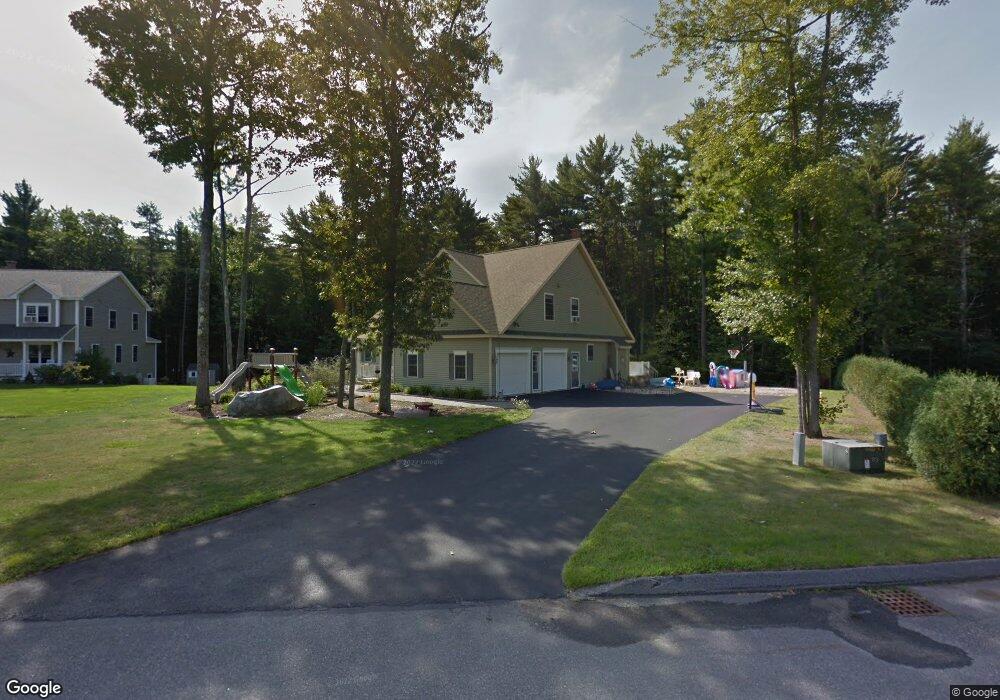
9 Lisa Ln Biddeford, ME 04005
Estimated Value: $709,000 - $892,000
4
Beds
4
Baths
3,298
Sq Ft
$238/Sq Ft
Est. Value
About This Home
This home is located at 9 Lisa Ln, Biddeford, ME 04005 and is currently estimated at $786,058, approximately $238 per square foot. 9 Lisa Ln is a home located in York County with nearby schools including John F Kennedy Memorial School, Biddeford Primary School, and Biddeford Intermediate School.
Ownership History
Date
Name
Owned For
Owner Type
Purchase Details
Closed on
Dec 6, 2016
Sold by
Grohman Amy
Bought by
Grohman Lt and Gorhman
Current Estimated Value
Purchase Details
Closed on
Jun 22, 2006
Sold by
Moran Kimberly B and Moran Brian J
Bought by
Grohman Amy
Home Financials for this Owner
Home Financials are based on the most recent Mortgage that was taken out on this home.
Original Mortgage
$344,000
Interest Rate
6.59%
Mortgage Type
Purchase Money Mortgage
Create a Home Valuation Report for This Property
The Home Valuation Report is an in-depth analysis detailing your home's value as well as a comparison with similar homes in the area
Home Values in the Area
Average Home Value in this Area
Purchase History
We collect this data history from publicly available records. To have your information removed, we recommend requesting removal directly through your county’s website.
| Date | Buyer | Sale Price | Title Company |
|---|---|---|---|
| Grohman Lt | -- | -- | |
| Grohman Amy | -- | -- | |
| Grohman Amy | -- | -- | |
| Grohman Amy | -- | -- |
Source: Public Records
Mortgage History
We collect this data history from publicly available records. To have your information removed, we recommend requesting removal directly through your county’s website.
| Date | Status | Borrower | Loan Amount |
|---|---|---|---|
| Previous Owner | Grohman Amy | $344,000 |
Source: Public Records
Tax History
| Year | Tax Paid | Tax Assessment Tax Assessment Total Assessment is a certain percentage of the fair market value that is determined by local assessors to be the total taxable value of land and additions on the property. | Land | Improvement |
|---|---|---|---|---|
| 2025 | $9,838 | $658,500 | $179,600 | $478,900 |
| 2024 | $9,234 | $649,400 | $179,600 | $469,800 |
| 2023 | $8,479 | $646,300 | $176,500 | $469,800 |
| 2022 | $8,144 | $496,300 | $101,500 | $394,800 |
| 2021 | $7,190 | $419,400 | $87,500 | $331,900 |
| 2020 | $7,605 | $379,300 | $77,000 | $302,300 |
| 2019 | $5,380 | $379,300 | $77,000 | $302,300 |
| 2018 | $5,136 | $379,300 | $77,000 | $302,300 |
| 2017 | $7,390 | $368,200 | $77,000 | $291,200 |
| 2016 | $3,265 | $367,600 | $77,000 | $290,600 |
| 2015 | $6,962 | $367,600 | $77,000 | $290,600 |
| 2014 | $6,791 | $367,600 | $77,000 | $290,600 |
| 2013 | -- | $381,400 | $81,500 | $299,900 |
Source: Public Records
Map
Nearby Homes
Your Personal Tour Guide
Ask me questions while you tour the home.