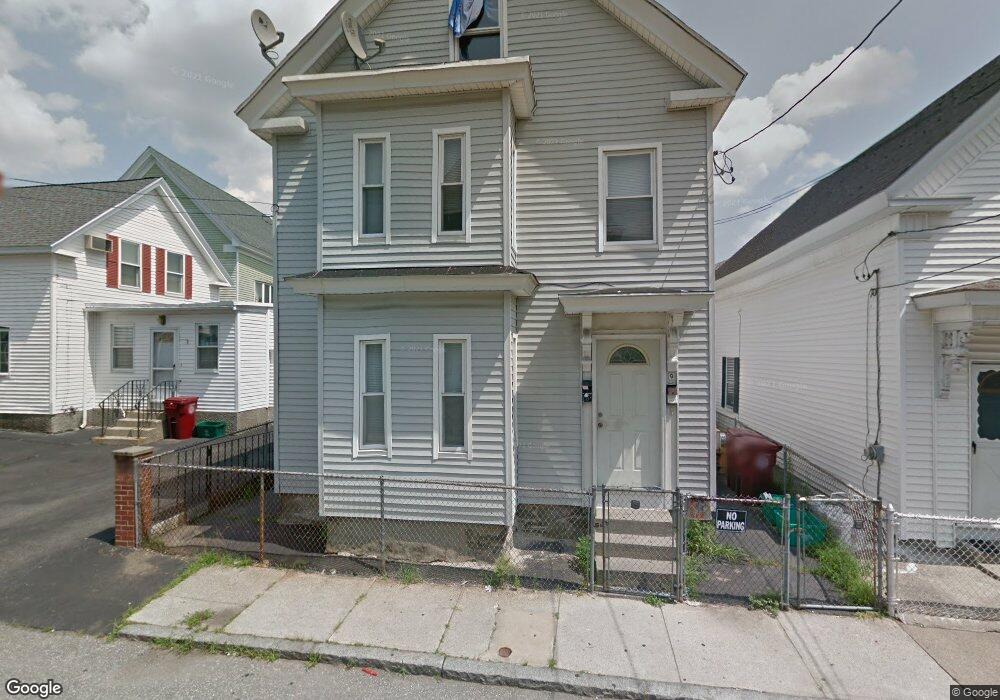
9 New St Lowell, MA 01852
Back Central NeighborhoodEstimated Value: $444,514 - $567,000
About This Home
This home is located at 9 New St, Lowell, MA 01852 and is currently estimated at $498,629, approximately $249 per square foot. 9 New St is a home located in Middlesex County with nearby schools including Moody Elementary School, Abraham Lincoln Elementary School, and Greenhalge Elementary School.
Ownership History
We collect this data history from publicly available records. To have your information removed, we recommend requesting removal directly through your county’s website.
Purchase Details
Purchase Details
Home Values in the Area
Average Home Value in this Area
Purchase History
We collect this data history from publicly available records. To have your information removed, we recommend requesting removal directly through your county’s website.
| Date | Buyer | Sale Price | Title Company |
|---|---|---|---|
| -- | None Available | ||
| $110,000 | -- |
Mortgage History
We collect this data history from publicly available records. To have your information removed, we recommend requesting removal directly through your county’s website.
| Date | Status | Borrower | Loan Amount |
|---|---|---|---|
| Previous Owner | $115,000 | ||
| Closed | $130,000 |
Tax History
We collect this data history from publicly available records. To have your information removed, we recommend requesting removal directly through your county’s website.
| Year | Tax Paid | Tax Assessment Tax Assessment Total Assessment is a certain percentage of the fair market value that is determined by local assessors to be the total taxable value of land and additions on the property. | Land | Improvement |
|---|---|---|---|---|
| 2025 | $4,727 | $411,800 | $92,600 | $319,200 |
| 2024 | $4,341 | $364,500 | $83,500 | $281,000 |
| 2023 | $4,040 | $325,300 | $72,600 | $252,700 |
| 2022 | $3,628 | $285,900 | $57,300 | $228,600 |
| 2021 | $3,368 | $250,200 | $49,800 | $200,400 |
| 2020 | $3,023 | $226,300 | $41,500 | $184,800 |
| 2019 | $2,922 | $208,100 | $38,400 | $169,700 |
| 2018 | $2,714 | $188,600 | $36,600 | $152,000 |
| 2017 | $2,666 | $178,700 | $39,900 | $138,800 |
| 2016 | $2,712 | $178,900 | $40,100 | $138,800 |
| 2015 | $2,497 | $161,300 | $40,100 | $121,200 |
| 2013 | $2,089 | $139,200 | $46,300 | $92,900 |
Map
- 34 Newhall St Unit 212
- 22 Floyd St
- 9 Bassett St
- 562 Gorham St Unit 2
- 562 Gorham St Unit 4
- 562 Gorham St Unit 3
- 562 Gorham St Unit 1
- 716 Lawrence St
- 50 Andrews St
- 708 Central St
- 380 Lawrence St
- 52 Auburn St
- 18 Auburn St
- 33 S Whipple St
- 130 Andrews St Unit 130
- 23 Ames St
- 5 Lenox St Unit 4
- 544 Concord St
- 8 Cady St
- 100 Rogers St Unit 1
Ask me questions while you tour the home.