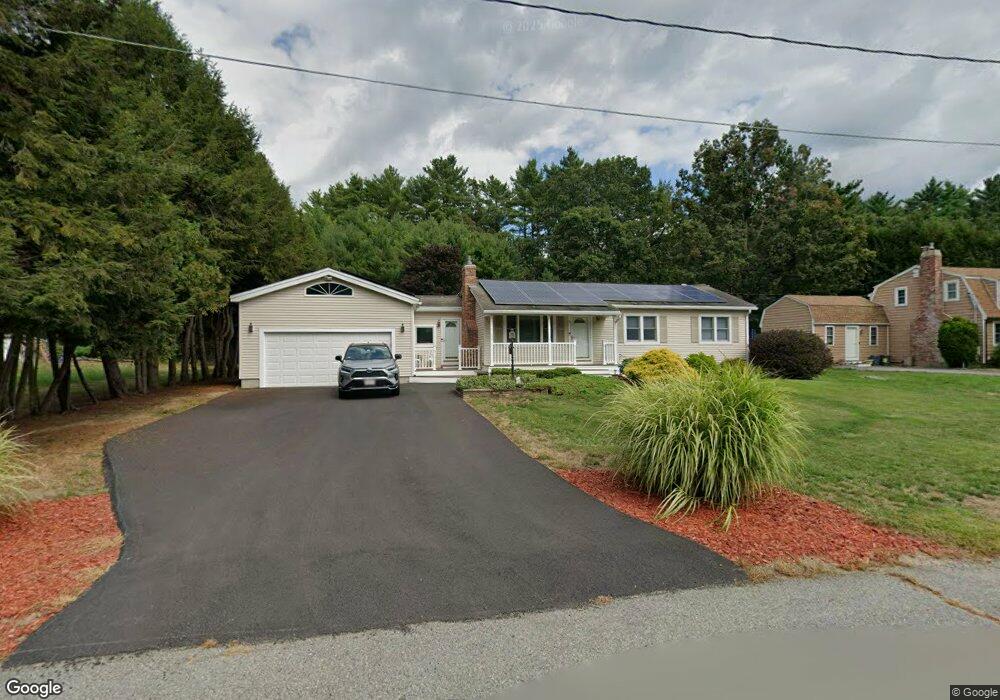
9 Redwood St Townsend, MA 01469
Estimated Value: $454,000 - $509,000
3
Beds
1
Bath
1,877
Sq Ft
$253/Sq Ft
Est. Value
About This Home
This home is located at 9 Redwood St, Townsend, MA 01469 and is currently estimated at $475,732, approximately $253 per square foot. 9 Redwood St is a home located in Middlesex County with nearby schools including North Middlesex Regional High School.
Ownership History
Date
Name
Owned For
Owner Type
Purchase Details
Closed on
Apr 13, 2022
Sold by
Delorey Daniel P and Delorey Patricia A
Bought by
Delorey Ft and Delorey
Current Estimated Value
Purchase Details
Closed on
Jun 5, 1978
Bought by
Delorey Daniel P and Deleo Patricia A
Create a Home Valuation Report for This Property
The Home Valuation Report is an in-depth analysis detailing your home's value as well as a comparison with similar homes in the area
Home Values in the Area
Average Home Value in this Area
Purchase History
We collect this data history from publicly available records. To have your information removed, we recommend requesting removal directly through your county’s website.
| Date | Buyer | Sale Price | Title Company |
|---|---|---|---|
| Delorey Ft | -- | None Available | |
| Delorey Daniel P | $35,000 | -- |
Source: Public Records
Mortgage History
We collect this data history from publicly available records. To have your information removed, we recommend requesting removal directly through your county’s website.
| Date | Status | Borrower | Loan Amount |
|---|---|---|---|
| Previous Owner | Delorey Daniel P | $174,405 | |
| Previous Owner | Delorey Daniel P | $25,000 | |
| Previous Owner | Delorey Daniel P | $93,000 |
Source: Public Records
Tax History
| Year | Tax Paid | Tax Assessment Tax Assessment Total Assessment is a certain percentage of the fair market value that is determined by local assessors to be the total taxable value of land and additions on the property. | Land | Improvement |
|---|---|---|---|---|
| 2025 | $5,444 | $374,900 | $90,700 | $284,200 |
| 2024 | $5,339 | $370,500 | $90,700 | $279,800 |
| 2023 | $4,831 | $316,600 | $78,300 | $238,300 |
| 2022 | $4,994 | $283,600 | $71,700 | $211,900 |
| 2021 | $5,145 | $280,700 | $70,900 | $209,800 |
| 2020 | $4,960 | $254,100 | $64,300 | $189,800 |
| 2019 | $4,883 | $252,600 | $64,300 | $188,300 |
| 2018 | $4,559 | $225,000 | $57,700 | $167,300 |
| 2017 | $4,294 | $218,300 | $60,600 | $157,700 |
| 2016 | $3,970 | $200,500 | $60,600 | $139,900 |
| 2015 | $4,017 | $210,200 | $67,200 | $143,000 |
| 2014 | $3,736 | $190,900 | $63,100 | $127,800 |
Source: Public Records
Map
Nearby Homes
- 100 S Harbor Rd
- 122 S Row Rd
- 8 South St
- Lot 10 Christian Cir
- 55 Beachview Rd
- 79 Tyler Rd
- 1 Depot Street Extension Unit 1
- 1 Depot Street Extension Unit 4
- 1 Depot Street Extension Unit 5
- 1 Kayla Ln
- 65 S Row Rd
- 41 Brookline St
- 184 Fitchburg Rd
- 5 Turnpike Rd Unit 226
- 919 Chase Rd
- 64 Meadow Rd
- 167 Townsend Harbor Rd
- 32 Hemlock Dr
- 87A Brookline St
- 131 Jewett St
Your Personal Tour Guide
Ask me questions while you tour the home.