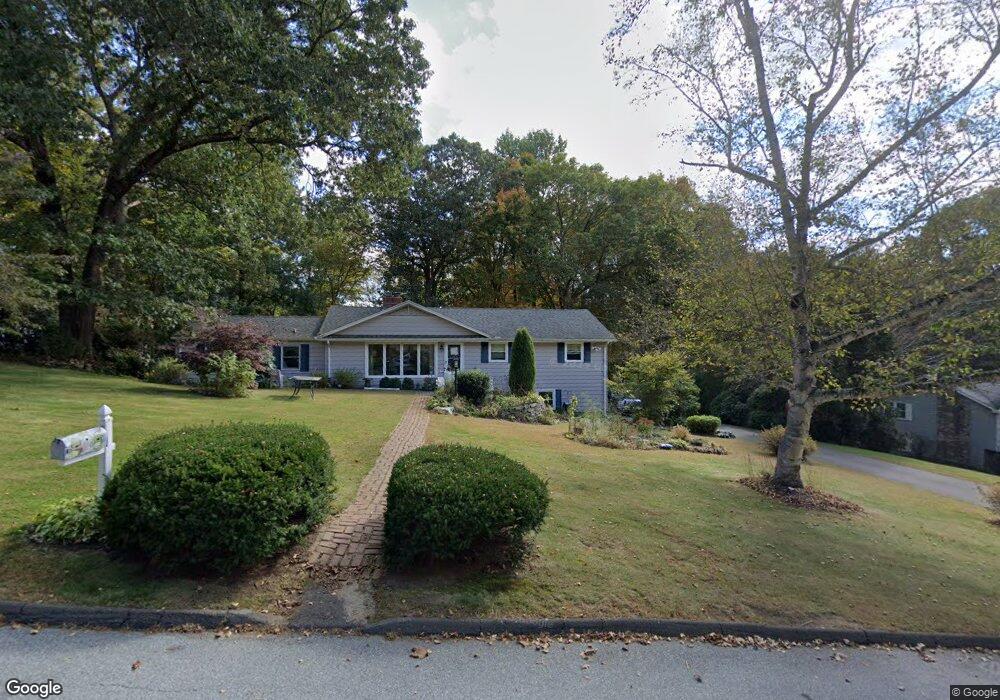
9 Sherry Dr East Hampton, CT 06424
East Hampton AreaEstimated Value: $392,000 - $434,000
3
Beds
2
Baths
1,648
Sq Ft
$249/Sq Ft
Est. Value
About This Home
This home is located at 9 Sherry Dr, East Hampton, CT 06424 and is currently estimated at $409,729, approximately $248 per square foot. 9 Sherry Dr is a home located in Middlesex County with nearby schools including Memorial School, Center Elementary School, and East Hampton Middle School.
Create a Home Valuation Report for This Property
The Home Valuation Report is an in-depth analysis detailing your home's value as well as a comparison with similar homes in the area
Home Values in the Area
Average Home Value in this Area
Tax History
We collect this data history from publicly available records. To have your information removed, we recommend requesting removal directly through your county’s website.
| Year | Tax Paid | Tax Assessment Tax Assessment Total Assessment is a certain percentage of the fair market value that is determined by local assessors to be the total taxable value of land and additions on the property. | Land | Improvement |
|---|---|---|---|---|
| 2025 | $5,477 | $137,930 | $42,120 | $95,810 |
| 2024 | $5,247 | $137,930 | $42,120 | $95,810 |
| 2023 | $4,974 | $137,930 | $42,120 | $95,810 |
| 2022 | $4,781 | $137,930 | $42,120 | $95,810 |
| 2021 | $4,763 | $137,930 | $42,120 | $95,810 |
| 2020 | $4,692 | $141,580 | $41,380 | $100,200 |
| 2019 | $4,936 | $148,950 | $44,330 | $104,620 |
| 2018 | $4,665 | $148,950 | $44,330 | $104,620 |
| 2017 | $4,665 | $148,950 | $44,330 | $104,620 |
| 2016 | $4,385 | $148,950 | $44,330 | $104,620 |
| 2015 | $4,262 | $153,410 | $56,470 | $96,940 |
| 2014 | $3,708 | $153,410 | $56,470 | $96,940 |
Source: Public Records
Map
Nearby Homes
Your Personal Tour Guide
Ask me questions while you tour the home.