9 Shumway Cir Wakefield, MA 01880
West Side NeighborhoodEstimated Value: $1,080,000 - $1,226,000
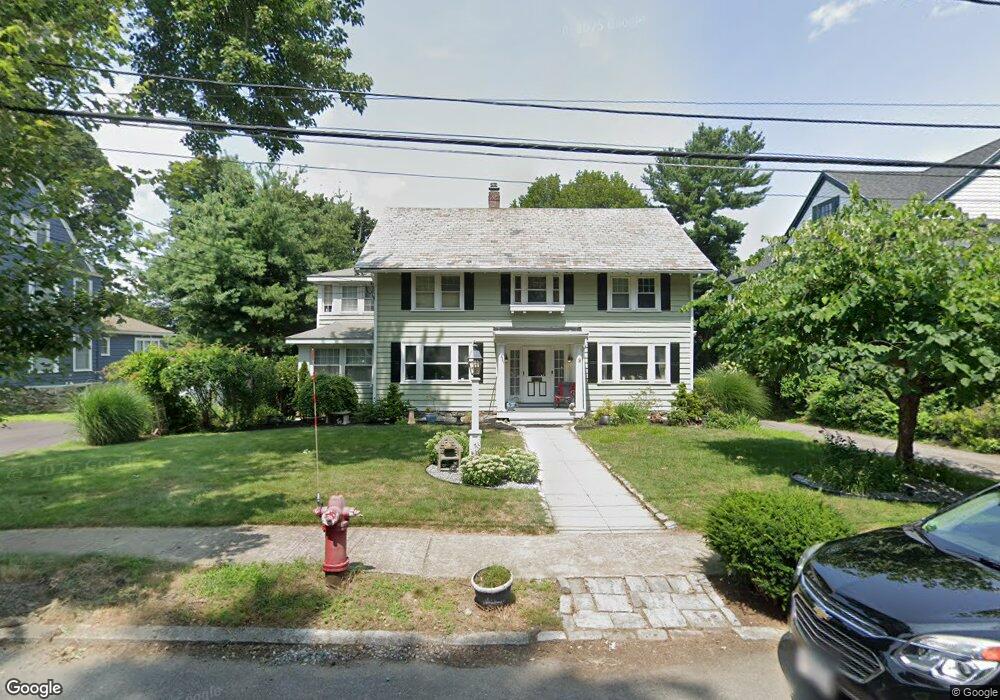
About This Home
This home is located at 9 Shumway Cir, Wakefield, MA 01880 and is currently estimated at $1,153,097, approximately $438 per square foot. 9 Shumway Cir is a home located in Middlesex County with nearby schools including Wakefield Memorial High School, St Joseph School, and St. Patrick Elementary School.
Ownership History
We collect this data history from publicly available records. To have your information removed, we recommend requesting removal directly through your county’s website.
Purchase Details
Home Financials for this Owner
Home Financials are based on the most recent Mortgage that was taken out on this home.Home Values in the Area
Average Home Value in this Area
Purchase History
We collect this data history from publicly available records. To have your information removed, we recommend requesting removal directly through your county’s website.
| Date | Buyer | Sale Price | Title Company |
|---|---|---|---|
| $585,000 | -- |
Mortgage History
We collect this data history from publicly available records. To have your information removed, we recommend requesting removal directly through your county’s website.
| Date | Status | Borrower | Loan Amount |
|---|---|---|---|
| Open | $468,000 |
Tax History
We collect this data history from publicly available records. To have your information removed, we recommend requesting removal directly through your county’s website.
| Year | Tax Paid | Tax Assessment Tax Assessment Total Assessment is a certain percentage of the fair market value that is determined by local assessors to be the total taxable value of land and additions on the property. | Land | Improvement |
|---|---|---|---|---|
| 2025 | $11,753 | $1,035,500 | $414,800 | $620,700 |
| 2024 | $10,959 | $974,100 | $390,000 | $584,100 |
| 2023 | $10,783 | $919,300 | $367,900 | $551,400 |
| 2022 | $10,306 | $836,500 | $334,500 | $502,000 |
| 2021 | $9,957 | $782,200 | $314,400 | $467,800 |
| 2020 | $9,406 | $736,600 | $296,100 | $440,500 |
| 2019 | $8,991 | $700,800 | $281,700 | $419,100 |
| 2018 | $8,651 | $668,000 | $268,600 | $399,400 |
| 2017 | $8,490 | $651,600 | $262,000 | $389,600 |
| 2016 | $8,017 | $594,300 | $260,000 | $334,300 |
| 2015 | $7,712 | $572,100 | $250,200 | $321,900 |
| 2014 | $7,170 | $561,000 | $245,300 | $315,700 |
Map
- 24 Bellevue Rd
- 71 Converse St
- 13 Parker Rd
- 47 Winship Dr
- 16 Mansion Rd
- 1 Summit Dr Unit 24
- 22 Eustis Ave
- ONE Summit Dr Unit 57
- 64 Main St Unit 45B
- 64 Main St Unit 21B
- 3 Summit Dr Unit 17
- 66 Main St Unit 11A
- 3 Walnut St
- 116 Parker Rd
- 62 High St Unit Lot 8
- 713 Gazebo Cir Unit 713
- 293 Albion St
- 48 N Emerson St Unit 1
- 48 Macarthur Rd
- 346 Albion St
- 154 Prospect St
- 158 Prospect St
- 152 Prospect St
- 151 Prospect St
- 149 Prospect St
- 148 Prospect St
- 61 Bellevue Rd
- 99 Park Ave
- 145 Prospect St
- 157 Prospect St
- 59 Shumway Cir
- 21 Shumway Cir
- 4 Bellevue Rd
- 1 Morrison Rd
- 165 Prospect St
- 165 Prospect St Unit 1
- 7 Shumway Cir
- 14 Bellevue Rd
- 7 Vale View Rd
- 168 Prospect St
Ask me questions while you tour the home.