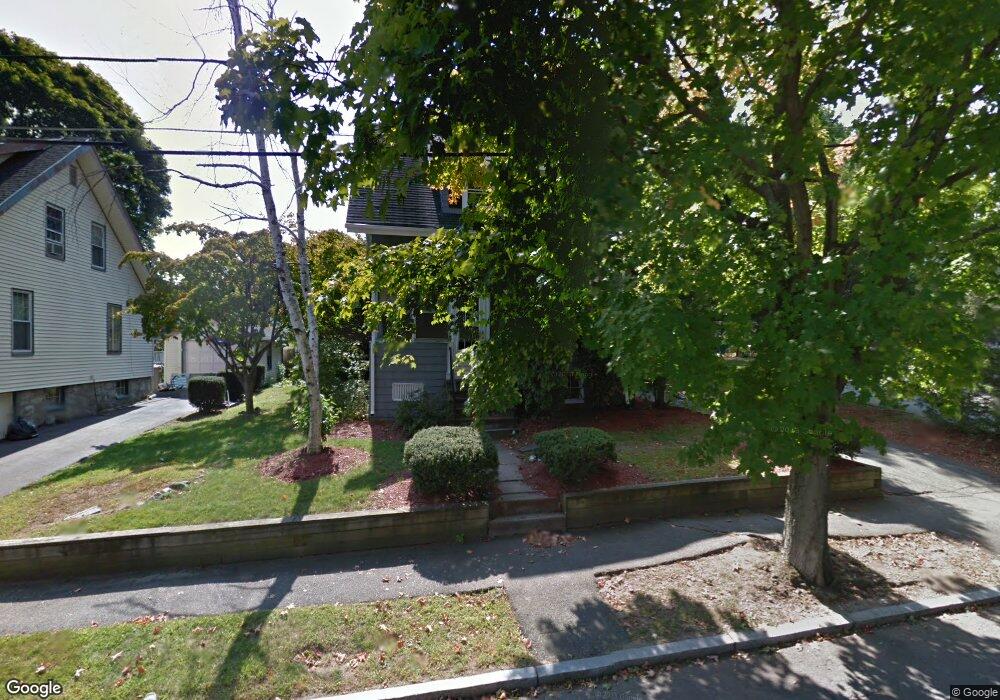
9 Simonds Rd Melrose, MA 02176
Mount Hood NeighborhoodEstimated Value: $669,000 - $952,000
About This Home
This home is located at 9 Simonds Rd, Melrose, MA 02176 and is currently estimated at $749,493, approximately $802 per square foot. 9 Simonds Rd is a home located in Middlesex County with nearby schools including Winthrop Elementary School, Horace Mann Elementary School, and Hoover Elementary School.
Ownership History
We collect this data history from publicly available records. To have your information removed, we recommend requesting removal directly through your county’s website.
Purchase Details
Home Financials for this Owner
Home Financials are based on the most recent Mortgage that was taken out on this home.Home Values in the Area
Average Home Value in this Area
Purchase History
We collect this data history from publicly available records. To have your information removed, we recommend requesting removal directly through your county’s website.
| Date | Buyer | Sale Price | Title Company |
|---|---|---|---|
| $148,000 | -- |
Mortgage History
We collect this data history from publicly available records. To have your information removed, we recommend requesting removal directly through your county’s website.
| Date | Status | Borrower | Loan Amount |
|---|---|---|---|
| Open | $170,000 | ||
| Closed | $100,000 | ||
| Previous Owner | $40,000 |
Tax History
We collect this data history from publicly available records. To have your information removed, we recommend requesting removal directly through your county’s website.
| Year | Tax Paid | Tax Assessment Tax Assessment Total Assessment is a certain percentage of the fair market value that is determined by local assessors to be the total taxable value of land and additions on the property. | Land | Improvement |
|---|---|---|---|---|
| 2025 | $60 | $609,300 | $443,400 | $165,900 |
| 2024 | $5,748 | $578,900 | $416,500 | $162,400 |
| 2023 | $5,794 | $556,000 | $403,100 | $152,900 |
| 2022 | $5,821 | $550,700 | $403,100 | $147,600 |
| 2021 | $5,624 | $513,600 | $376,200 | $137,400 |
| 2020 | $5,231 | $473,400 | $335,900 | $137,500 |
| 2019 | $4,728 | $437,400 | $310,400 | $127,000 |
| 2018 | $4,636 | $409,200 | $282,200 | $127,000 |
| 2017 | $4,535 | $384,300 | $268,700 | $115,600 |
| 2016 | $4,483 | $363,600 | $262,000 | $101,600 |
| 2015 | $4,296 | $331,500 | $235,100 | $96,400 |
| 2014 | $4,046 | $304,700 | $208,300 | $96,400 |
Map
- 86 Highview Ave
- 214 Laurel St
- 29 East St
- 21 Vista St
- 25 Cumner Ave
- 122 Altamont Ave
- 389 Porter St
- 228 Upham St
- 78 Hammersmith Dr
- 408 Swains Pond Ave
- 73 Florence Ave
- 29 Hammersmith Dr
- 51 Gooch St
- 12C Cheever Ave
- 639 Lynn Fells Pkwy
- 9 Hammersmith Dr
- 646 Lynn Fells Pkwy
- 9 Elm St
- 127 Larchmont Rd
- 26 1st St
Ask me questions while you tour the home.