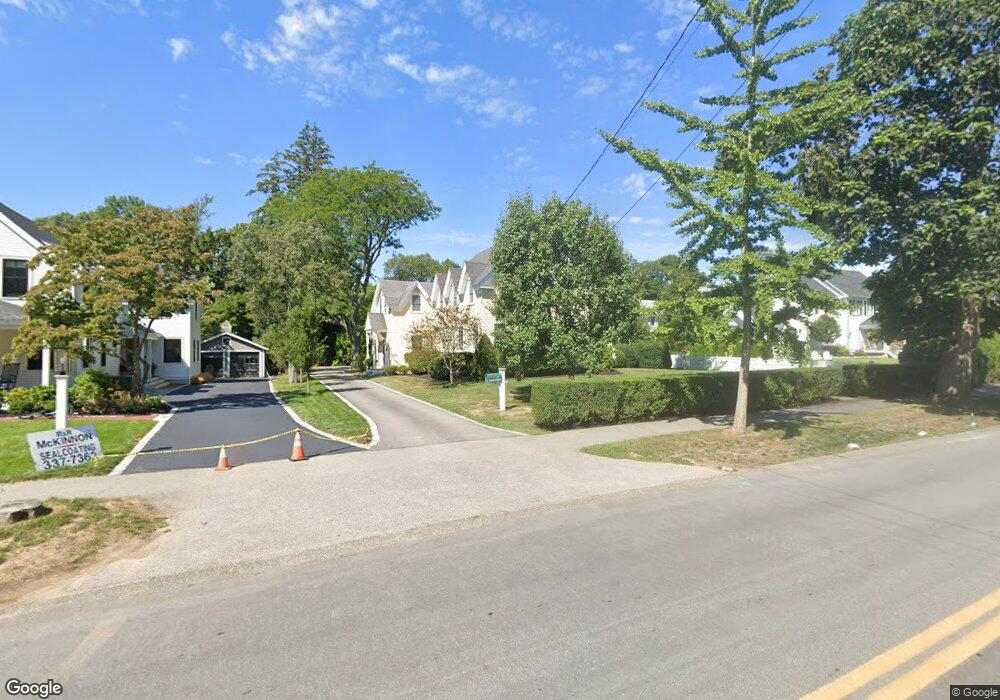
9 Union St Hingham, MA 02043
Estimated Value: $1,524,000 - $2,184,000
4
Beds
4
Baths
3,238
Sq Ft
$554/Sq Ft
Est. Value
About This Home
This home is located at 9 Union St, Hingham, MA 02043 and is currently estimated at $1,794,373, approximately $554 per square foot. 9 Union St is a home located in Plymouth County with nearby schools including East Elementary School, Hingham Middle School, and Hingham High School.
Ownership History
Date
Name
Owned For
Owner Type
Purchase Details
Closed on
May 13, 2022
Sold by
Calame Richard A and Calame Mara D
Bought by
Calame Ft and Calame
Current Estimated Value
Purchase Details
Closed on
Nov 3, 2021
Sold by
Calame Ft and Calame
Bought by
Calame Richard and Calame Mara D
Home Financials for this Owner
Home Financials are based on the most recent Mortgage that was taken out on this home.
Original Mortgage
$170,000
Interest Rate
2.15%
Mortgage Type
New Conventional
Purchase Details
Closed on
Jul 3, 2014
Sold by
Calame Richard A and Calame Mara D
Bought by
Calame Ft and Calame
Purchase Details
Closed on
Nov 20, 2000
Sold by
Matthew Rt and Davidson Geoffrey A
Bought by
Calame Richard A and Calame Mara D
Purchase Details
Closed on
Apr 19, 2000
Sold by
Est Macconnell N Jr and Macconnell Phyllis B
Bought by
Matthew Rt and Bridgeman Frank J
Create a Home Valuation Report for This Property
The Home Valuation Report is an in-depth analysis detailing your home's value as well as a comparison with similar homes in the area
Purchase History
| Date | Buyer | Sale Price | Title Company |
|---|---|---|---|
| Calame Ft | -- | None Available | |
| Calame Ft | -- | None Available | |
| Calame Richard | -- | None Available | |
| Calame Richard | -- | None Available | |
| Calame Ft | -- | -- | |
| Calame Richard A | $745,000 | -- | |
| Matthew Rt | $325,000 | -- | |
| Calame Ft | -- | -- | |
| Calame Richard A | $745,000 | -- | |
| Matthew Rt | $325,000 | -- |
Source: Public Records
Mortgage History
| Date | Status | Borrower | Loan Amount |
|---|---|---|---|
| Previous Owner | Calame Richard | $170,000 | |
| Previous Owner | Matthew Rt | $350,000 |
Source: Public Records
Tax History
| Year | Tax Paid | Tax Assessment Tax Assessment Total Assessment is a certain percentage of the fair market value that is determined by local assessors to be the total taxable value of land and additions on the property. | Land | Improvement |
|---|---|---|---|---|
| 2025 | $13,541 | $1,266,700 | $568,100 | $698,600 |
| 2024 | $13,579 | $1,251,500 | $568,100 | $683,400 |
| 2023 | $12,303 | $1,230,300 | $568,100 | $662,200 |
| 2022 | $12,325 | $1,066,200 | $512,900 | $553,300 |
| 2021 | $12,099 | $1,025,300 | $493,200 | $532,100 |
| 2020 | $11,822 | $1,025,300 | $493,200 | $532,100 |
| 2019 | $12,001 | $1,016,200 | $493,200 | $523,000 |
| 2018 | $10,908 | $926,800 | $493,200 | $433,600 |
| 2017 | $11,141 | $909,500 | $507,100 | $402,400 |
| 2016 | $10,974 | $878,600 | $483,000 | $395,600 |
| 2015 | $10,509 | $838,700 | $460,100 | $378,600 |
Source: Public Records
Map
Nearby Homes
Your Personal Tour Guide
Ask me questions while you tour the home.