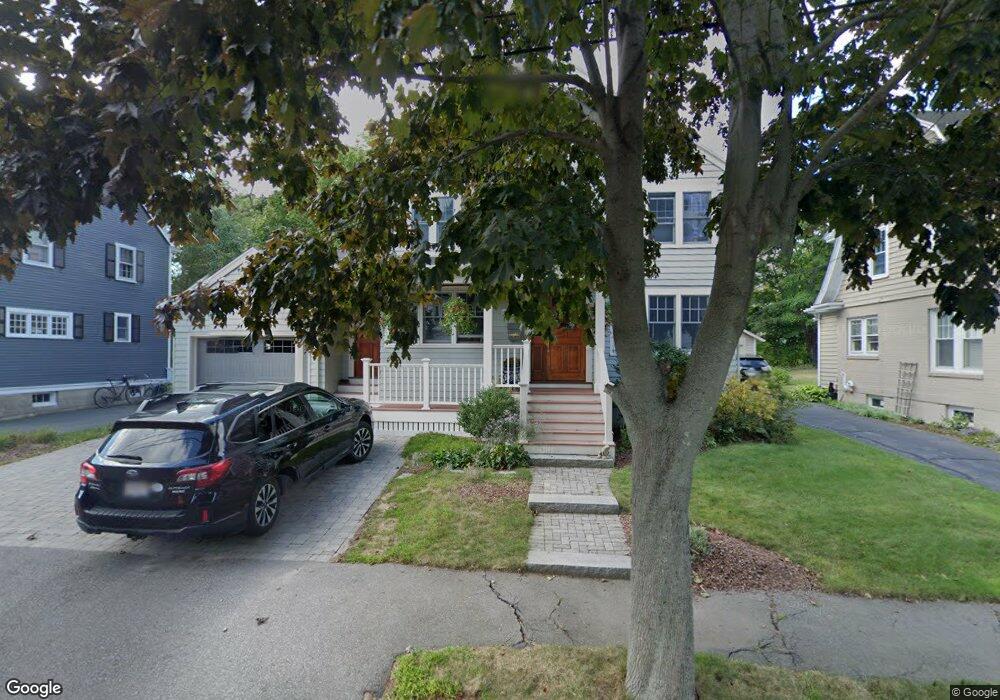
9 Weston Rd Marblehead, MA 01945
Estimated Value: $1,099,450 - $1,290,000
5
Beds
4
Baths
2,556
Sq Ft
$465/Sq Ft
Est. Value
About This Home
This home is located at 9 Weston Rd, Marblehead, MA 01945 and is currently estimated at $1,187,613, approximately $464 per square foot. 9 Weston Rd is a home located in Essex County with nearby schools including Marblehead High School, Devereux School, and Tower School.
Ownership History
Date
Name
Owned For
Owner Type
Purchase Details
Closed on
Aug 23, 1989
Sold by
Lausier Paul
Bought by
Braun Gerald
Current Estimated Value
Create a Home Valuation Report for This Property
The Home Valuation Report is an in-depth analysis detailing your home's value as well as a comparison with similar homes in the area
Home Values in the Area
Average Home Value in this Area
Purchase History
We collect this data history from publicly available records. To have your information removed, we recommend requesting removal directly through your county’s website.
| Date | Buyer | Sale Price | Title Company |
|---|---|---|---|
| Braun Gerald | $172,000 | -- |
Source: Public Records
Mortgage History
We collect this data history from publicly available records. To have your information removed, we recommend requesting removal directly through your county’s website.
| Date | Status | Borrower | Loan Amount |
|---|---|---|---|
| Open | Braun Gerald | $100,000 | |
| Closed | Braun Gerald | $128,000 |
Source: Public Records
Tax History
| Year | Tax Paid | Tax Assessment Tax Assessment Total Assessment is a certain percentage of the fair market value that is determined by local assessors to be the total taxable value of land and additions on the property. | Land | Improvement |
|---|---|---|---|---|
| 2025 | $8,750 | $966,900 | $637,000 | $329,900 |
| 2024 | $9,563 | $1,067,300 | $762,900 | $304,400 |
| 2023 | $8,005 | $800,500 | $505,900 | $294,600 |
| 2022 | $8,275 | $786,600 | $499,600 | $287,000 |
| 2021 | $7,675 | $736,600 | $449,600 | $287,000 |
| 2020 | $7,192 | $692,200 | $449,600 | $242,600 |
| 2019 | $7,167 | $667,300 | $424,700 | $242,600 |
| 2018 | $7,078 | $642,300 | $399,700 | $242,600 |
| 2017 | $6,659 | $604,800 | $362,200 | $242,600 |
| 2016 | $6,575 | $592,300 | $349,700 | $242,600 |
| 2015 | $5,907 | $533,100 | $324,700 | $208,400 |
| 2014 | $5,587 | $503,800 | $299,800 | $204,000 |
Source: Public Records
Map
Nearby Homes
- 1 Maverick St Unit 2
- 282 Pleasant St
- 27 Maverick St
- 28 Orchard St
- 82 Cornell Rd
- 53 Gerald Rd
- 40 Prospect St Unit 3
- 14 Central St Unit B
- 2 Commercial St Unit 3
- 19 Humphrey St
- 25 Countryside Ln
- 290 Washington St Unit 2
- 2 Girdler Rd
- 126 Pleasant St
- 60 Gregory St Unit 3
- 9 Mount Vernon St
- 60 Brackett Place Unit D
- 197A W Shore Dr Unit A
- 9 Cedar St
- 16 Evans Rd Unit 2
Your Personal Tour Guide
Ask me questions while you tour the home.